
Project
Workforce Analytics and Bias Detection Using 360-Degree Performance Review Data
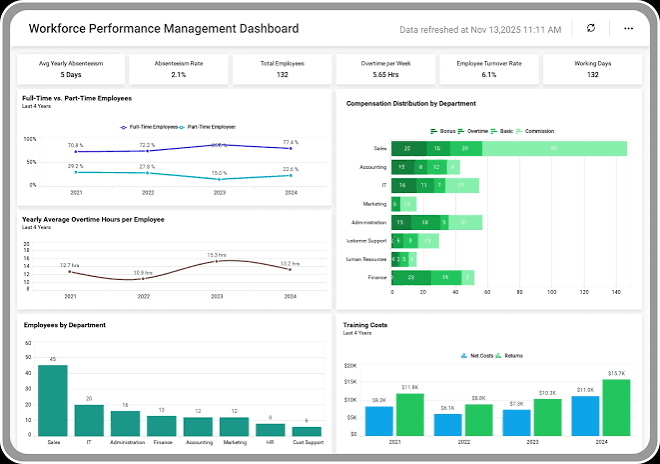
This project is based on a real-world case study of MC Foods Inc. (MCF), a large food company headquartered in the U.S., which uses a 360-degree employee evaluation process to assess performance across seven core values. The objective of the project was to analyze 2019 evaluation data, assess the integrity of performance and promotion decisions, and examine the potential for implicit bias across gender, ethnicity, and business units. The project reflects deep application of the analytics mindset — asking the right questions, transforming data, applying statistical and visual analysis, and effectively communicating insights. Data Overview: 675,000+ records from MCF’s 360-degree evaluations Each employee rated across 7 core values: Availability, Determination, Discipline, Humility, Ownership, Simplicity, Sincerity Ratings were collected from four sources: self, manager, cross group, and direct reports Includes demographics (age, gender, ethnicity), tenure, business unit, and location Key Objectives: Assess whether 360-degree ratings provide valid inputs for promotions and the Nine-Box Matrix Detect potential rating biases across gender, ethnicity, or rater categories Evaluate organizational performance by location, business unit, and manager influence Deliver strategic recommendations for improving performance evaluation fairness and accuracy Tools & Techniques Used: Power BI or Tableau for interactive visual dashboards Python (pandas, matplotlib, seaborn) or R (dplyr, ggplot2) for statistical modeling SPSS or Excel for data preprocessing, validation, and summary stats ETL Process: Cleaned, filtered, and validated over 675K records; handled missing values and inconsistent formats Key Analytical Components: Organizational Performance Assessment Visualized average non-self ratings by business unit and location Mapped performance scores to identify underperforming regions Compared manager vs. employee self-evaluations across core values Bias Detection and Fairness Analysis Analyzed ratings by gender and ethnic group, comparing self, manager, and peer evaluations Measured differences in manager ratings based on demographic similarity/difference between employee and manager Highlighted potential bias patterns in specific locations and business units Nine-Box Ranking Simulation Ranked employees based on average non-self ratings Segmented the workforce into top, middle, and bottom performers Examined the fairness of forced rankings and their reliance on subjective inputs Value-Specific Insights Assessed which of the 7 core values showed the greatest rating variability across departments and raters Highlighted values that are most subjective or difficult to assess fairly Custom Recommendations Suggested enhancements to the 360 process including additional inputs (e.g., KPIs, peer-reviewed contributions) Recommended combining qualitative feedback with quantitative scoring Proposed blind review pilots to reduce demographic-based bias Outcomes and Impact: Delivered a 4-page visual executive report with performance and DEI dashboards Identified departments and locations with potential evaluator bias Proposed data-driven improvements to MCF’s promotion and evaluation framework Showcased ability to apply advanced analytics to organizational behavior and HR processes This project reflects a robust application of people analytics, combining statistical reasoning, data visualization, and DEI auditing to support equitable talent management. It demonstrates your capability to handle large organizational datasets, uncover hidden patterns, and provide strategic insights for executive leadership.
Resources