
Projects & Research
The work, in detail.
Research, machine learning systems, spatial analysis, and AI applications.

Project
Inclusive AI & Edge IoT Engineering: Multimodal Assistive System for Educational & Spatial Accessibility in STEM
This project encompasses the full lifecycle conceptualization, hardware-software integration, and deployment plan for EduNav+, an AI-powered educational and indoor navigation assistant designed to enhance classroom participation and mobility for blind and visually impaired students in STEM disciplines. Spearheaded at Jomo Kenyatta University of Agriculture and Technology (JKUAT), the project combines embedded IoT hardware, computer vision models, mathematical OCR, and tactile/speech feedback systems into an integrated accessibility platform. The system architecture features a wearable unit—built on a Raspberry Pi 4, VL53L0X Time-of-Flight sensors, USB webcams, and HC-05 Bluetooth modules—paired with an Android companion application. The software pipeline leverages open-source machine learning frameworks, including YOLO for real-time obstacle detection and spatial navigation, Mathpix for parsing complex mathematical equations, and Whisper for speech recognition and lecture transcription. Whiteboard content and live instructional streams are processed via OCR and delivered to users through synthesized text-to-speech or a refreshable Braille pad. Guided by a seven-phase development workplan and a cost-conscious budget of Ksh 55,500 (~£300), the initiative incorporates empirical user testing with visually impaired students, establishing a scalable, educationally aligned assistive ecosystem that bridges the digital divide in scientific higher education.
Project
Enterprise Sales Intelligence Architecture & Commercial Analytics: Route-to-Market Optimization for FMCG Beverage Distribution
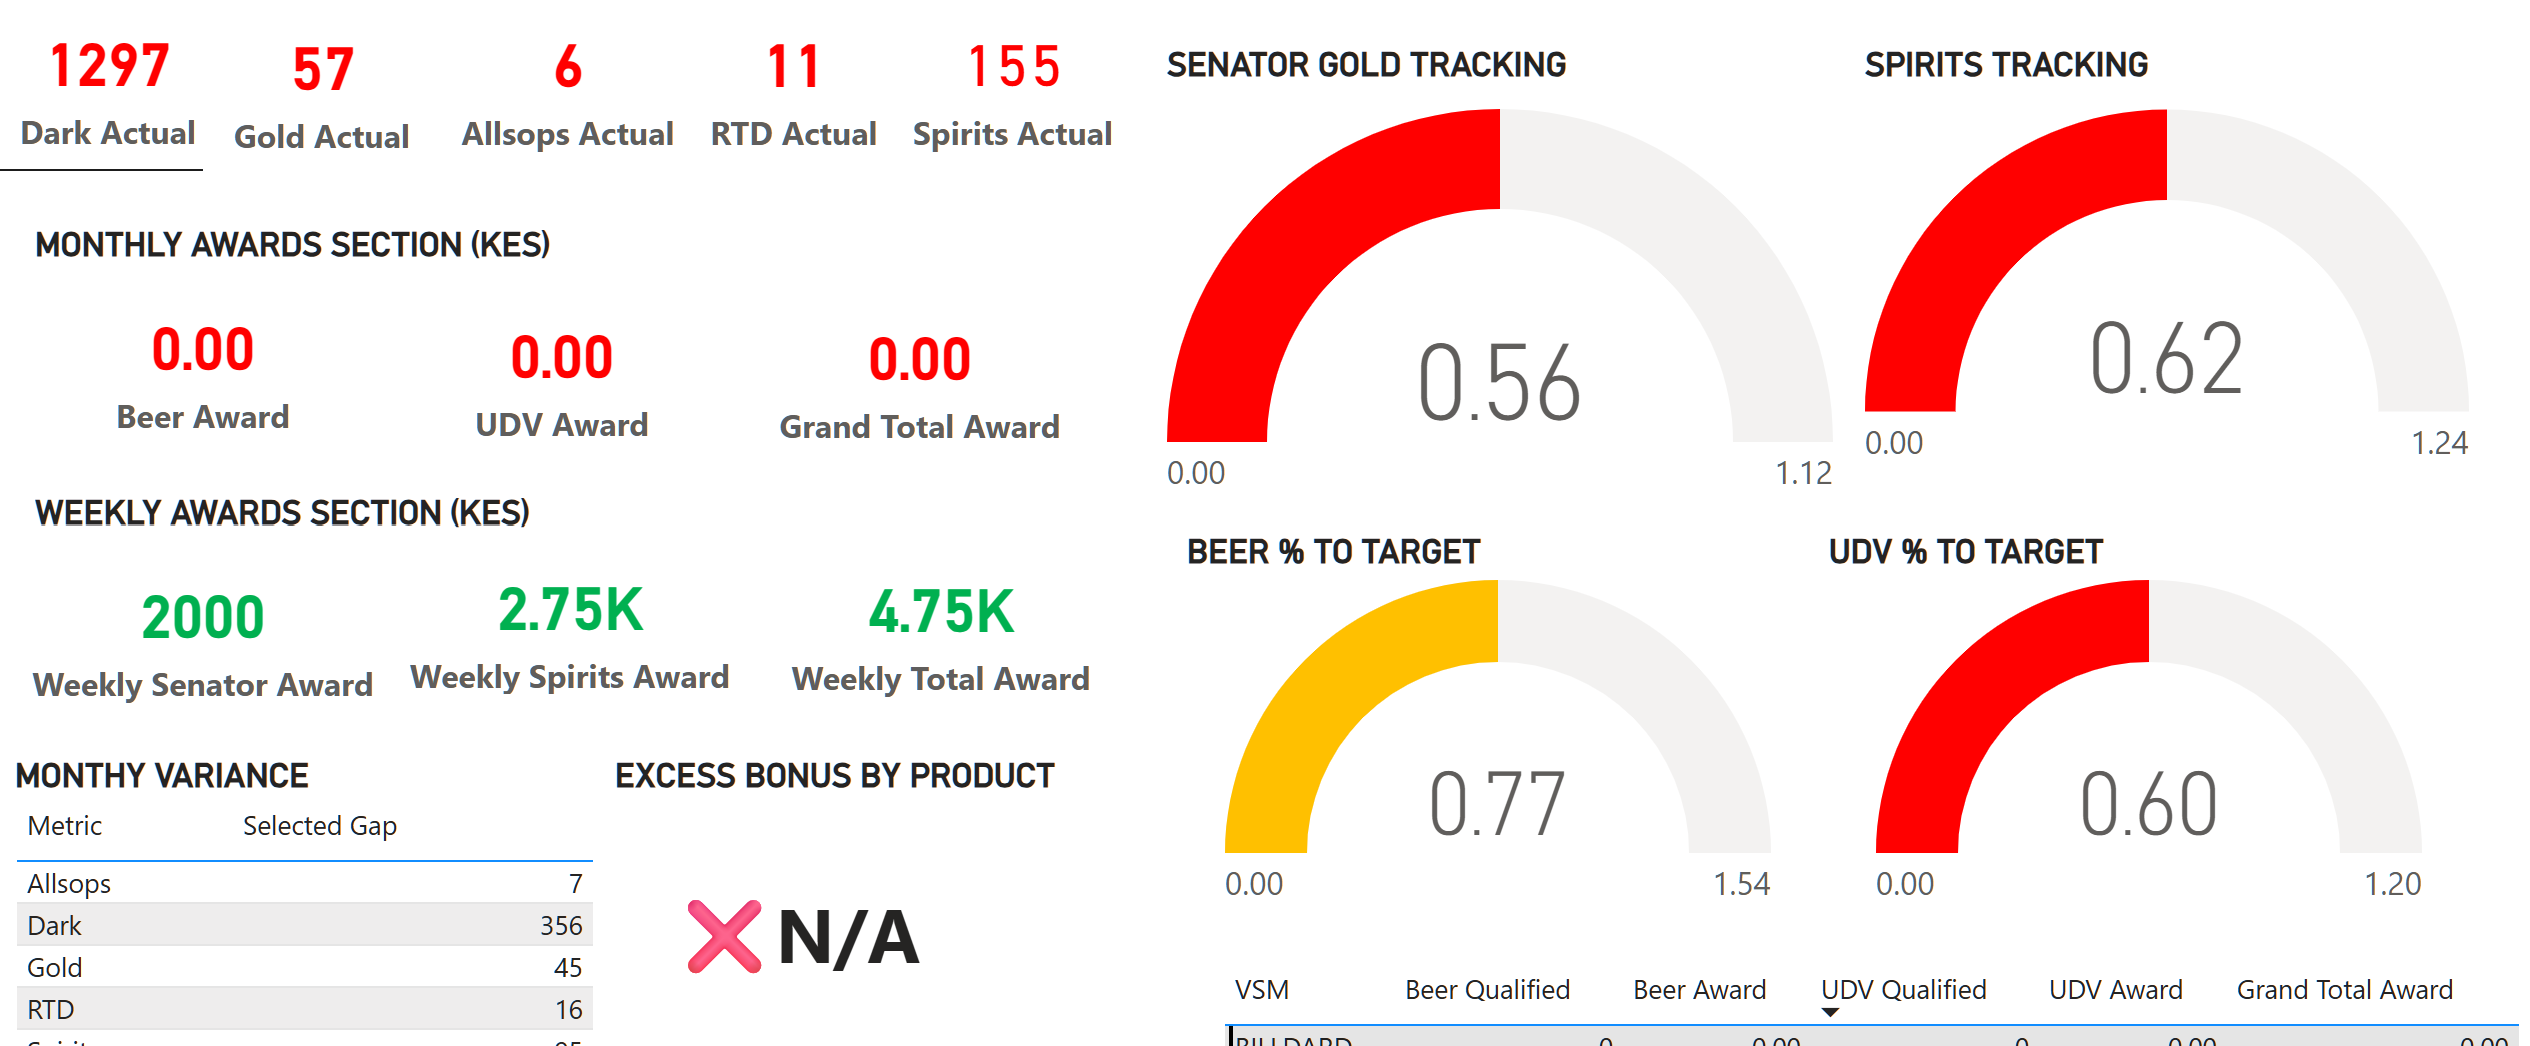
This project encompasses the data analytics and pipeline engineering operations executed for Mobilemary, an authorized commercial distributor operating under East African Breweries Limited (EABL) / Kenya Breweries Limited (KBL). Focused on optimizing beverage distribution dynamics and commercial sales performance across regional territories, the initiative integrates end-to-end data pipelines, automated reporting templates, and interactive Business Intelligence (BI) dashboards to convert high-volume transactional data into actionable strategic insights. The data infrastructure ingests, cleans, and transforms daily primary and secondary sales records, inventory turnover rates, and outlet fulfillment metrics. Custom analytics dashboards—built across Power BI, Looker Studio, and advanced spreadsheet architectures—deliver real-time visibility into key performance indicators (KPIs), including sales velocity by brand, category mix performance (beers, spirits, and RTDs), distributor account receivables, and route productivity. By engineering automated sales tracking workflows and standardized reporting templates, the platform provides executive leadership with data-driven sales forecasts, optimizes stock replenishment cycles, and guides route-to-market (RTM) decision-making across commercial distribution routes.

Project
Full-Stack AI-Driven Certified Document Translation Platform: Automated Pipeline for Official French-to-English Identity Artifacts
This project delivered the end-to-end product design, full-stack architecture, and production deployment of the Viargues translation platform, a specialized web application engineered for the certified translation of official French government documents into standardized English formats. Developed entirely across the software lifecycle—from initial UI/UX prototyping and MVP validation to full application release—the system automates the processing of high-stakes legal and identity artifacts, including passports, national identity cards, driver's licenses, and visa records. The core translation engine integrates Anthropic’s Large Language Model (LLM) API, utilizing custom context rules and prompt orchestration to guarantee strict adherence to legal terminology, official administrative register, and structural document fidelity. The platform features a secure, stream-lined document ingestion pipeline that manages file upload states, extracts key field hierarchies, and executes precise French-to-English contextual translation. Once processed, the output is passed through an automated PDF rendering engine, generating publication-ready, certified English translation documents structured to meet the formal standards required by immigration authorities, legal bodies, and government agencies.

Project
Full-Stack Direct-to-Consumer E-Commerce Platform & Relational Database Architecture for Perishable Retail
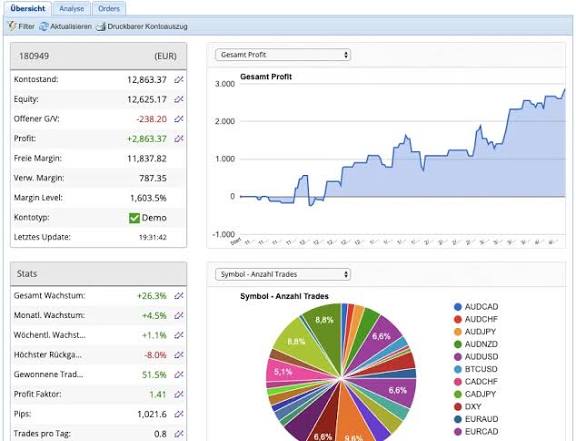
This project encompassed the end-to-end full-stack web development and database engineering of a modern direct-to-consumer (DTC) e-commerce platform for A&D Halal Fresh Meat, a specialized premium butcher shop based in Marlton, New Jersey. Built to digitize regional retail fulfillment and streamline online order processing, the solution integrates an aesthetically polished, trust-focused front-end user interface with a robust, scalable back-end database tailored for perishable inventory management and localized logistics. The front-end design prioritizes conversion rate optimization (CRO) and brand authentication through strategic visual hierarchy and prominent trust badging. Key compliance indicators—including 100% Halal certification, hand-cut daily protocols, USDA inspection standards, and enterprise ownership verification—are embedded into the sticky top bar header to build immediate consumer confidence. The hero section features responsive media handling, micro-interactions, and clear CTA pathways ("Shop Now", "View Best Sellers"), backed by an intuitive navigation architecture covering the main store, brand commitments, FAQs, and contact workflows. The UI includes dynamic cart state tracking, customer account login interfaces, global product search, and conditional promo banners (such as automated free delivery thresholds for orders exceeding $150). On the back end, the system relies on a custom relational database schema engineered to manage complex product data models, item variants (weight-based pricing, cut options, and stock levels), and transactional order histories. The database architecture supports real-time inventory synchronization to prevent overselling of daily fresh-cut inventory, customer account management, and localized delivery routing logic mapped across New Jersey target regions. Combined with fully responsive layout design, optimized web performance assets, and secure payment gateway integrations, the platform delivers a high-speed, frictionless digital storefront tailored for retail meat distribution.
Project
Empirical Evaluation of AfCFTA Operationalization and Export Performance Mechanics in Kenya's Manufacturing Sector: Quantitative Survey and Psychometric Reliability Analysis
This project executed the quantitative data processing, psychometric validation, and descriptive statistical synthesis for Chapter 4 of an empirical study investigating the operationalization of the African Continental Free Trade Area (AfCFTA) and its impact on Kenya’s manufacturing export sector. Analyzing primary survey data across four core dimensions—Tariff Liberalization (TL), Trade Facilitation Reforms (TFR), Export Diversification (ED), and Institutional Frameworks (IF)—against Manufacturing Export Performance (EP), the study processed $N = 389$ raw questionnaire submissions using Microsoft Excel and IBM SPSS Statistics (version 26). Following rigorous data cleaning to resolve branching logic anomalies, item formatting inconsistencies, and multiple-response errors, a randomized subsample ($n = 33$) was reserved exclusively for pre-administration pilot reliability testing, leaving a main analytical sample of $N = 356$ manufacturing export representatives and institutional stakeholders.Psychometric evaluation of the five multi-item constructs (comprising 50 total 5-point Likert scale items) demonstrated exceptional internal consistency during pilot pre-testing. Cronbach’s alpha ($\alpha$) coefficients substantially exceeded the standard $0.70$ threshold across all domains: Tariff Liberalization ($\alpha = 0.971$), Export Diversification ($\alpha = 0.963$), Trade Facilitation Reforms ($\alpha = 0.957$), Institutional Frameworks ($\alpha = 0.954$), and Manufacturing Export Performance ($\alpha = 0.930$). Corrected item-total correlations across all 50 indicators comfortably surpassed the $0.30$ baseline (ranging from $0.580$ to $0.930$), confirming high construct validity prior to full-scale deployment. Demographic profiling of the main analytical sample ($N = 356$) revealed a distribution predominantly representing mature, large-scale commercial entities: 44.9% ($n = 160$) were large enterprises ($\ge 250$ employees), 36.5% ($n = 130$) were medium firms, and 18.5% ($n = 66$) were small enterprises. Export firm representatives constituted 98.6% ($n = 351$) of respondents, highlighting an institutional key informant shortfall ($n = 4$ government respondents vs. 30 targeted). Furthermore, 68.8% of respondents possessed 2 to 10 years of personal export trade experience, with 49.7% ($n = 177$) designating East Africa as their primary export destination. Baseline descriptive indicators across the five constructs demonstrated narrow item mean clustering between $2.6$ and $3.4$, capturing a cautious, moderately favorable perception among Kenyan manufacturers regarding initial AfCFTA implementation benefits.
Project
Occupational Stress & Sleep Pathology Analytics: Inferential Evaluation of Stress, BMI, and Demographic Determinants on Sleep Metrics among Working Adults
This project delivered an end-to-end inferential data science investigation into the impacts of occupational stress, professional roles, gender dynamics, and body mass index (BMI) on sleep quality and clinical sleep disorder prevalence among working adults. Analyzing the Sleep Health and Lifestyle Dataset ($N = 374$ records reduced across 8 primary demographic and clinical variables), the study formulated a quantitative pipeline in Python utilizing pandas, scipy.stats, matplotlib, and seaborn to execute descriptive and inferential hypothesis testing without relying on black-box machine learning models. Initial data hygiene addressed structural redundancies by standardizing duplicate BMI labels (merging "Normal Weight" into "Normal") and recoding unpopulated diagnostic fields as non-pathological baseline cases ("None"), reflecting the explicit absence of diagnosed clinical disorders rather than missing data.The exploratory and statistical analysis evaluated five core hypotheses to delineate the primary drivers of sleep degradation. Bivariate correlation testing revealed an exceptionally strong inverse relationship between self-reported stress levels and sleep quality (Pearson $r = -0.899, p < 0.001$; Spearman $\rho = -0.908, p < 0.001$), as well as total sleep duration (Pearson $r = -0.811, p < 0.001$; Spearman $\rho = -0.811, p < 0.001$), confirming that psychological strain severely suppresses sleep metrics across population strata. Variance analysis across eleven distinct professional categories demonstrated significant inter-occupational disparities in sleep quality (One-Way ANOVA $F = 30.022, p < 0.001$; Kruskal-Wallis $H = 166.094, p < 0.001$). High median sleep quality was reported among Engineers and Nurses, whereas marked reductions were observed in high-pressure roles such as Sales Representatives and Scientists. Gender-stratified independent Welch's t-tests revealed a statistically significant disparity ($t = -5.859, p < 0.001$), with female respondents reporting higher mean sleep quality ($7.66$) compared to male counterparts ($6.97$).Categorical association testing via Chi-Square ($\chi^2$) tests of independence demonstrated profound interactions between physical health indicators, occupational environments, and clinical sleep pathologies. BMI category showed a highly significant association with sleep disorder diagnosis ($\chi^2 = 245.665, df = 4, p < 0.001$), where individuals with normal BMI were overwhelmingly free of diagnosed conditions ($200/216$), while overweight and obese groups exhibited heightened susceptibility to both Insomnia ($n = 64$) and Sleep Apnea ($n = 65$). Furthermore, occupation was significantly tied to specific clinical diagnoses ($\chi^2 = 421.363, df = 20, p < 0.001$), uncovering domain-specific risk clusters: Nurses suffered disproportionately high rates of Sleep Apnea ($61/73$), whereas Salespeople ($29/32$) and Teachers ($27/40$) displayed acute clustering of Insomnia. Supported by a publication-ready visual suite—including linear regression trend plots, occupational boxplots, stacked bar charts, and correlation heatmaps—the study delivers empirical evidence to inform targeted workplace wellbeing policies and shift-work health interventions.

Project
Quantitative Assessment of Knowledge, Attitudes, and Practices Regarding Birth Preparedness Among Antenatal Care Attendees at Gatundu Level 5 Hospital: A Cross-Sectional KAP Survey Analysis
This project comprised the statistical processing, descriptive data synthesis, and academic reporting for Chapters 4 and 5 of a quantitative maternal health study conducted at Gatundu Level 5 Hospital, Kenya. The primary objective was to evaluate the Knowledge, Attitudes, and Practices (KAP) regarding Birth Preparedness and Complication Readiness (BPCR) among pregnant women attending the facility's Antenatal Care (ANC) clinic. Utilizing a structured cross-sectional survey design, primary data were collected from $N = 156$ respondents against a calculated sample size of 155, yielding a 100% response rate. The analytical workflow involved processing categorical demographic profiles, constructing percentage frequency distributions, analyzing multiple-response sets for information sources and BPCR components, evaluating 5-point Likert scale attitudinal responses, and determining the rate of practical behavioral translation.Statistical profiling of the study population revealed a predominantly young, educated, yet economically vulnerable cohort. The modal age group was 20–24 years (37.9%), with half of the respondents having completed college-level education (50.0%) and an additional 15.8% attaining university education. Despite high literacy levels, financial constraints were evident, as 39.3% reported a monthly household income of less than Ksh 10,000. From an obstetric perspective, over half of the respondents were experiencing their first pregnancy (55.4%) and were nulliparous (56.2%), highlighting the central role of ANC-based health education in guiding first-time mothers through birth planning. Geographic accessibility was generally high, with 86.1% residing within 10 km of the facility and 31.5% having achieved four or more ANC visits at the time of sampling.Assessing knowledge dimensions indicated a very strong baseline awareness of birth preparedness concepts. Overall, 92.7% of respondents had previously heard of birth preparedness, and 96.7% correctly identified a health facility as the recommended delivery site. The hospital's ANC clinic was identified as the primary source of health information (66.4%), outperforming informal networks and media channels. When evaluating specific BPCR elements, financial preparation (saving money) was the most recognized component (82.9%), whereas identifying a potential blood donor was the least recognized (52.6%). Attitudinal assessments across ten Likert-scale statements demonstrated overwhelmingly positive perceptions toward structured birth planning. The highest consensus was recorded for the general importance of birth preparedness (84.1% strongly agree, 12.6% agree), with virtually non-existent disagreement across all evaluated items ($< 1.0\%$).Crucially, the study demonstrated a high rate of translation from theoretical knowledge and positive attitudes into concrete preparatory practices. The vast majority of respondents had established an emergency contact for labor (92.0%), saved money for delivery expenses (90.0%), and identified a health facility for delivery (88.1%). However, subtle operational gaps emerged in direct clinical engagement: identifying a specific skilled birth attendant (78.7%) and formally discussing a birth plan with a healthcare provider (79.5%) lagged behind general domestic arrangements. Synthesis of these findings emphasizes that while health education at Gatundu Level 5 Hospital successfully instills foundational preparedness, targeted interventions are still required to improve emergency-specific planning—such as blood donor identification and formalized birth plan reviews—to further reduce maternal and neonatal risks in peri-urban Kenyan health systems.
Project
Epidemiological Equity Analysis and Longitudinal Intervention Trajectories of Taenia solium Control Programs using Custom Equiplot Visualizations in R
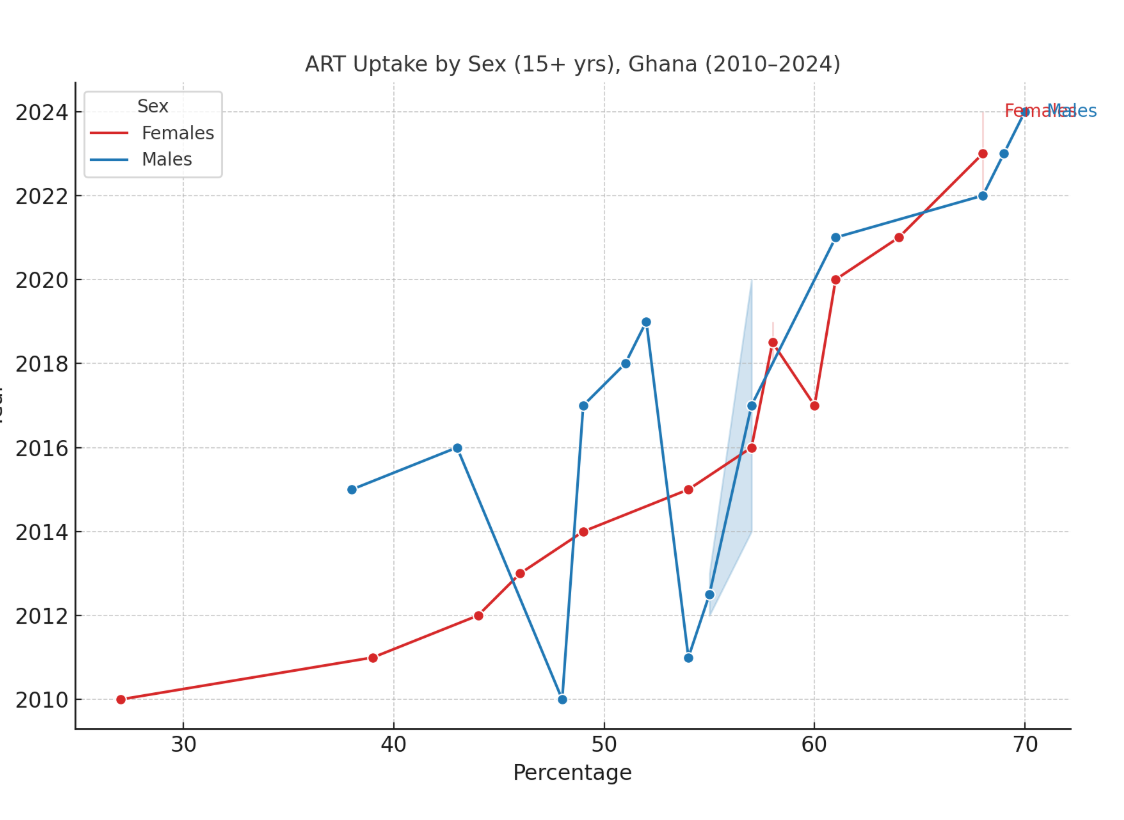
This project executed a comprehensive biostatistical and epidemiological evaluation of public health intervention equity and coverage trajectories for neglected tropical disease (NTD) control—specifically focusing on Taenia solium (taeniasis/cysticercosis) transmission dynamics and comparative healthcare uptake across vulnerable demographic strata. Evaluating long-term progress toward World Health Organization (WHO) control and elimination targets requires rigorous tracking of health disparities over time, assessing whether mass drug administration (MDA), diagnostic screening, or targeted therapeutic coverage is equitably distributed across sex, age groups, and socioeconomic divisions. To rigorously quantify and communicate these longitudinal equity gaps, custom equiplots and health equity disparity curves were engineered using the R statistical computing environment (ggplot2, dplyr, and patchwork). Equiplots serve as a critical tool in global public health and implementation science, explicitly mapping how coverage percentages evolve across distinct population subgroups (such as males versus females aged 15+ years) across a multi-year observational window (spanning 2010 through 2024). The statistical workflow involved ingesting multi-stage cluster survey data and longitudinal surveillance records, preprocessing disaggregated coverage metrics, and calculating point estimates alongside 95% parametric confidence intervals to account for sampling variability and complex survey design effects. Data normalization and structural reshaping transformed sparse, multi-cohort epidemiological matrices into tidy formats optimized for custom programmatic rendering in R. The visual architecture of the equiplots was tailored to optimize clinical and policy interpretability. By mapping calendar years against percentage coverage axes with flipped coordinate dynamics, the visualization clearly contrasts subgroup trajectories—such as the differential uptake rates between females and males—while highlighting critical inflection points, divergence trends, and transient coverage shocks. For instance, the analysis highlighted baseline equity gaps in early intervention years (where male participation lagged at 38.0% compared to female baseline trajectories), followed by sharp, non-linear fluctuations during mid-program phases (including temporary drop-offs down to 48.2% around structural healthcare disruptions), before undergoing steady convergence toward equitable high-coverage plateaus exceeding 68.0% to 70.0% in recent years. Point-wise uncertainty was incorporated using shaded confidence ribbons and vertical error bars, ensuring that non-overlapping intervals could be visually audited for statistical significance across adjacent timepoints. In addition to raw coverage tracking, the analytical framework evaluated subgroup disparity ratios, slope indexes of inequality (SII), and relative indexes of inequality (RII) to measure whether targeted public health strategies effectively reduced structural marginalization over time. The generating scripts in R incorporated custom theme scaffolding—utilizing minimalist grid structures, direct inline label annotations (eliminating cognitive load from legend cross-referencing), color-blind accessible palettes, and precise scale formatting—to deliver publication-ready graphics suitable for policy briefs and epidemiological reports. Ultimately, this work bridges complex longitudinal biostatistics with clear equity visualization, establishing a scalable data framework to monitor NTD intervention parity, optimize resource allocation, and drive data-informed strategies for endemic disease elimination.
Project
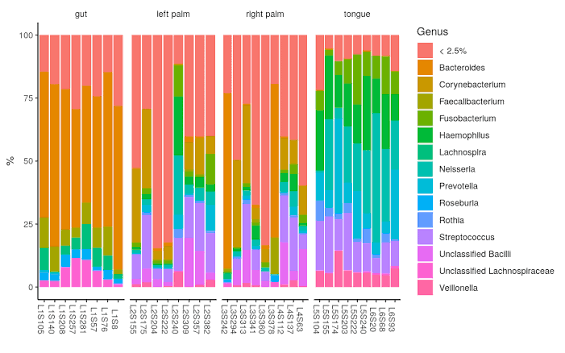
Longitudinal Gut Microbiota Assembly in Mothers and Children: Diversity Dynamics, Taxon-Richness Scaling, and Ecological Maturation Drivers
This project executed a longitudinal biostatistical evaluation of human gut microbiota development, contrasting the ecological assembly of infant and early childhood gut communities against the mature, resilient microbial ecosystems of mothers across $>1,200$ distinct bacterial taxa derived from 16S rRNA gene sequencing ($N = 1,124$ total profiles; $n = 757$ child, $n = 367$ mother). The primary analytical objectives were twofold: first, to map the temporal trajectories of microbial richness ($S$) and Shannon diversity ($H'$) across key developmental timepoints (10 days, 3 months, 1 year, 2 years, and maternal pregnancy); and second, to interrogate whether ecological richness scaling is driven by specific taxonomic expansions—specifically the short-chain fatty acid (SCFA)-producing family Lachnospiraceae—or governed by macro-ecological constraints like total microbial load.Data preprocessing and quality control protocols involved standardizing taxonomic nomenclature, converting zero-counts, log-transforming raw abundances, and performing sample-wise centering to stabilize high right-skewness and total count variance. Four complementary alpha diversity metrics were engineered: Species Richness, Total Abundance (microbial load), Shannon Index, and Pielou's Evenness ($J'$). Taxa belonging to Lachnospiraceae were aggregated into a unified family-level abundance metric to isolate its functional contribution to overall community complexity.Longitudinal diversity tracking revealed starkly contrasting ecological trajectories between cohorts. Infants initiated life with extremely simple, low-diversity pioneer communities at 10 days (mean richness $= 22.38 \pm 9.34$), followed by a progressive, non-linear expansion in taxonomic complexity through 1 year ($58.64 \pm 15.90$) and 2 years ($87.64 \pm 21.46$). A transient dip in diversity observed at 3 months ($79.71 \pm 59.07$) captured a critical window of early-life ecological turnover, likely reflecting dietary transitions, immune priming, or pioneer species replacement. Conversely, maternal gut communities exhibited persistent homeostatic stability, maintaining elevated richness ($129.87 \pm 37.43$ during pregnancy) and steady Shannon diversity across all sampling periods, illustrating a fully saturated and resilient climax ecosystem.To determine the ecological forces governing community assembly, non-parametric Spearman rank correlations and multivariable linear interaction models were deployed. The expansion of Lachnospiraceae was strongly correlated with overall community richness across the full dataset ($r = 0.732$), but group-stratified analyses demonstrated that this relationship was uniquely driven by the child cohort ($r = 0.776$ in children vs. $r = 0.188$ in mothers). A formal interaction model (Lachnospiraceae $\times$ Host Group) yielded a statistically significant interaction term ($p < 0.05$), confirming that Lachnospiraceae proliferation acts as an age-specific biological hallmark of microbiome maturation during early childhood. Conversely, total microbial load shared an inverse relationship with richness in both children ($r = -0.476$) and mothers ($r = -0.237$). The total abundance $\times$ host group interaction was not statistically significant, demonstrating that high-load single-taxon dominance constraints operate as a universal, age-invariant ecological mechanism that suppresses species evenness across all life stages.Model diagnostics—including residual Q-Q plots, fitted-versus-residual checks, and Shapiro-Wilk testing—highlighted expected non-normality and heteroscedasticity inherent to sparse microbiome count data. To account for repeated measures, within-subject temporal dependencies, and sample size imbalances across timepoints, linear mixed-effects models (lme4/lmerTest in R) with random intercepts per participant were implemented, validating the non-parametric findings and ensuring rigorous statistical inference.
Project
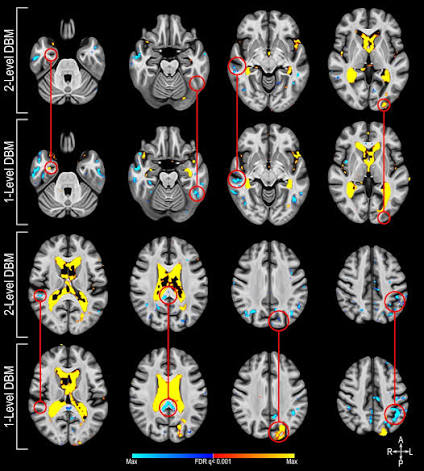
Descriptive Evidence Synthesis and Methodological Risk-of-Bias Audit of MRI-Based AI Models for Intracranial Tumor Differentiation
This project conducted a comprehensive systematic review and descriptive evidence synthesis evaluating the diagnostic, predictive, and segmentation performance of MRI-based artificial intelligence (AI), radiomics, and deep learning architectures (CNNs, transfer learning, and computer-aided diagnostic models) for preoperative differentiation of sellar, parasellar, skull-base, and extra-axial intracranial lesions across $N = 21$ studies. The target pathology spectrum encompassed pituitary adenomas/PitNETs, craniopharyngiomas, Rathke cleft cysts (RCC), tuberculum sellae meningiomas, solitary fibrous tumors/hemangiopericytomas (SFT/HPC), and vestibular schwannomas. While initial protocol objectives aimed for quantitative pooling, a formal Network Meta-Analysis (NMA) was precluded due to structural evidence disconnects across all 50 extracted model comparisons, alongside widespread under-reporting of $95\%$ confidence intervals, standard errors, and usable $2 \times 2$ contingency matrices in primary literature. Executing a structured descriptive synthesis and QUADAS-2 risk-of-bias audit revealed that 13 of 21 studies ($62\%$) exhibited high risk of bias, driven by single-center retrospective designs, internal-only cross-validation, and potential image-level data leakage in public benchmark datasets. Detailed narrative comparisons were constructed for genuine overlapping clinical tasks, including adamantinomatous vs. papillary craniopharyngioma subtyping (AUCs spanning $0.763$ to $0.890$) and SFT/HPC vs. meningioma differentiation (AUCs up to $0.920$). The synthesis highlighted crucial reporting deficits in neuro-oncological AI research, establishing methodological standards for future multi-center validation and clinical translation.
Project
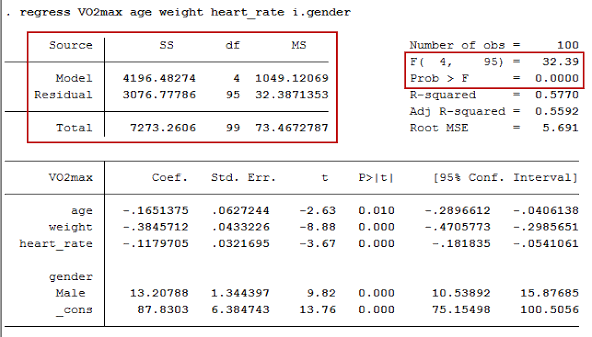
Stata-Based Epidemiological Analysis of Age Disparities in Homelessness, Substance Use Patterns, and Buprenorphine Access
This project executed a comprehensive quantitative data analysis and multivariable regression pipeline in Stata 15 SE to investigate age-related disparities in housing stability, substance use behaviors, and medication-for-opioid-use-disorder (MOUD) access among individuals experiencing homelessness ($N = 144$).The analytical methodology followed a rigorous data-cleaning, screening, and statistical modeling workflow: Data Management & Quality Control: Imported Qualtrics survey data, applied inclusion criteria (valid age 18–90, complete survey records), converted string fields using destring, and categorized respondents into a dichotomous age variable ($0 = 18\text{--}49$ years, $n = 112$; $1 = 50+$ years, $n = 32$). Descriptive & Bivariate Inference: Computed means, standard deviations, medians, and ranges for continuous measures, and proportions for categorical variables. Evaluated group differences using independent-samples t-tests, Pearson chi-square tests, and Fisher's exact tests. To control family-wise error across multiple hypothesis testing, a Bonferroni correction ($\alpha = 0.05 / 8 = 0.00625$) was applied. Multivariable Logistic Regression: Estimated sequential logistic regression models predicting the primary binary outcome—ever accessed buprenorphine (bupe_ever)—adjusting for age group, recent opioid and stimulant use, chronic pain, and past-month depression/anxiety days. Evaluated model performance using Akaike Information Criteria (AIC), Bayesian Information Criteria (BIC), Variance Inflation Factors (VIF) for multicollinearity, and the Hosmer-Lemeshow goodness-of-fit test. Effect Modification Analysis: Tested interaction terms between age group and substance use categories to explore moderated pathways in treatment access.
Project
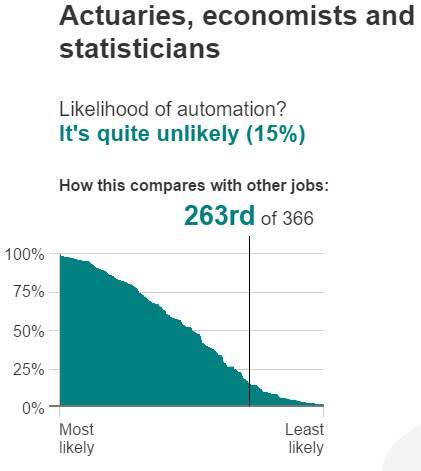
Data Analytics for Insurance and Actuarial Science: A Corporate Training Curriculum on Loss Reserving, GLM Pricing, and IFRS 17 Compliance
This project comprised the design and execution of an intensive 5-day executive corporate training program delivered in Lilongwe/Blantyre, Malawi, targeted at banking, financial services, and insurance (BFSI) professionals. The curriculum bridged fundamental insurance domain knowledge with quantitative actuarial modeling, predictive analytics, and executive visual reporting using computational workflows in Python, R, and Excel/Power BI. The 10-module pedagogical architecture covered the complete insurance analytics lifecycle: Actuarial Reserving & Loss Development: Implemented deterministic loss triangles, Chain Ladder methods, and Bornhuetter-Ferguson estimators to calculate Incurred But Not Reported (IBNR) loss reserves and perform stress-testing scenarios. Generalized Linear Models (GLMs) & Risk Pricing: Constructed rate-making models using Poisson (claim frequency) and Gamma (claim severity) link functions, evaluating model lift, Gini coefficients, and cross-validated out-of-sample performance to mitigate data leakage. Predictive Machine Learning & Telemetry: Built classification and ensemble models (Logistic Regression, Decision Trees, Random Forests) in R/Python to forecast policyholder churn, detect fraudulent claims clusters, and quantify large-loss risks. Regulatory Frameworks & Executive Dashboards: Addressed IFRS 17 / Solvency II compliance requirements, algorithmic pricing ethics, and data privacy regulations, culminating in interactive Power BI/Tableau reporting boards for executive decision-making.
Project
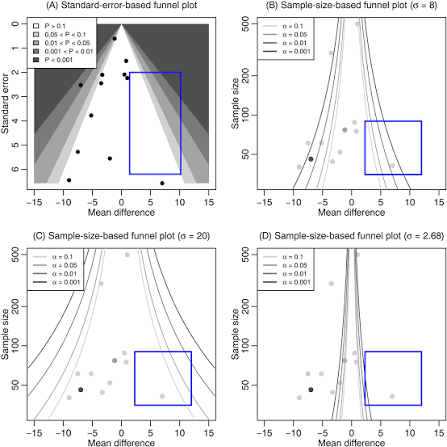
Funnel Plot Quality Indicators, Institutional Performance Benchmarking, and Publication Bias Assessment: An R-Based Visual Analytics Framework for Cancer Drainage Interventions
This project constructed an R-based statistical quality control and meta-analytic evaluation framework utilizing funnel plots to analyze clinical outcomes, institutional variability, and evidence synthesis across oncological drainage procedures (such as percutaneous transhepatic biliary drainage, endoscopic ultrasound-guided gallbladder/biliary drainage, and surgical lymphatic drainage). Funnel plots serve as a crucial diagnostic tool in clinical epidemiology, allowing researchers to evaluate institutional performance against national benchmarks while adjusting for sample size variations and extreme value inflation in small-volume centers.Using specialized R packages—including metafor, meta, funnelR, and ggplot2—the analytical pipeline processed procedural success metrics, complication rates, and post-procedural mortality telemetry. For institutional quality audit applications, Spiegelhalter-style control limits were constructed around target mean outcome rates at $95\%$ ($\pm 2\sigma$) pseudo-confidence limits and $99.8\%$ ($\pm 3\sigma$) control thresholds using exact binomial distributions and overdispersion adjustments. This enabled the identification of statistically significant institutional outliers (high or low clinical performance) without penalizing facilities with lower patient volumes.In the context of meta-analytic evidence synthesis, funnel plot asymmetry was rigorously evaluated alongside regression-based diagnostics (Egger’s test and Begg’s rank correlation test) to assess publication bias and small-study effects across published clinical trials. Trim-and-fill procedures were executed in R to impute missing study effect sizes and re-evaluate pooled risk ratios. The resulting visual analytics and quantitative diagnostics provided clinicians and healthcare administrators with robust, reproducible evidence to evaluate procedural safety, detect care delivery variations, and standardize oncological drainage protocols.
Project
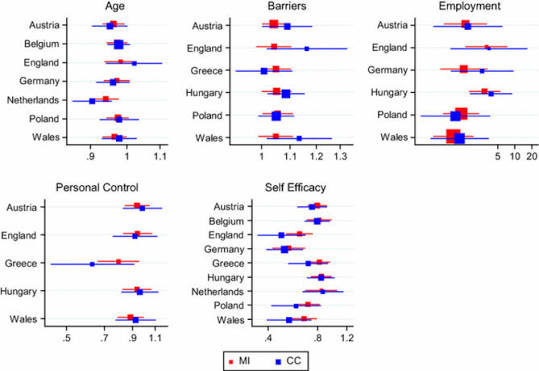
Meta-Analytic Effect Size Synthesis, Subgroup Disaggregation, and Forest Plot Visualization: An SPSS Empirical Evaluation of Behavioral Interventions
This project conducted a quantitative meta-analysis in IBM SPSS Statistics to synthesize empirical effect sizes across behavioral intervention studies and visualize pooled outcome metrics using high-resolution Forest plots. Utilizing SPSS meta-analytic procedures, the analysis processed study-level effect estimates from primary research outputs (.spv viewer data) to evaluate cumulative effect magnitudes across target behavioral constructs ("L behaviors").The analytical pipeline applied study selection filtering to isolate positive-effect studies and executed sensitivity analyses across disaggregated outcome categories. Statistical synthesis involved calculating weighted pooled effect sizes under fixed-effects and random-effects assumptions, alongside variance metrics and 95% confidence intervals. Heterogeneity across individual studies was quantified using standard diagnostic statistics, including Cochran’s $Q$, $I^2$ inconsistency metrics, and tau-squared ($\tau^2$) inter-study variance estimates.To support clear data communication and scientific reporting, the synthesized outputs were mapped into customized SPSS Forest plots. These visual diagrams displayed individual study weights, effect size point estimates with error bars, and diamond summary markers for overall pooled effects as well as disaggregated behavioral sub-domains, providing robust evidence-based insights for research and decision-making.
Project
Impact Assessment of Rural Maternal Healthcare Interventions: An R-Based Comparative Analysis of Health Worker Capacity, Consultation Telemetry, and Mortality Rates
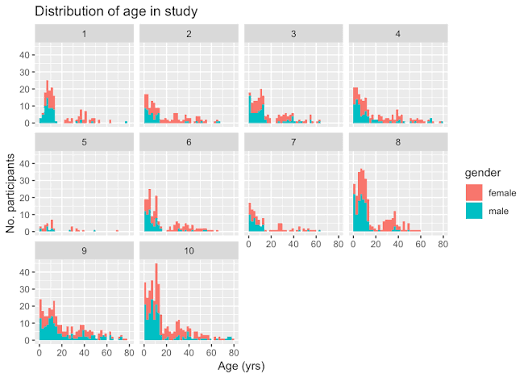
This project executed an empirical program evaluation analyzing the efficacy of a rural maternal health intervention aimed at improving service delivery and reducing avoidable maternal mortality. Using R, the quantitative study evaluated observational performance telemetry across healthcare personnel, comparing formally trained versus untrained workers across two primary clinical metrics: annual consultation volume and recorded maternal deaths.Data processing and statistical computation in R included cross-tabulations, subgroup mean comparisons, and bivariate correlation analysis. The empirical results demonstrated that trained healthcare workers conducted substantially higher annual consultations on average ($156.7$ vs. $65.0$) while registering lower average maternal deaths ($2.0$ vs. $4.5$). Furthermore, correlation analysis revealed a strong inverse relationship ($r = -0.70$) between patient consultation volume and maternal mortality, confirming that increased clinical interaction and formal worker training directly correspond to improved maternal health outcomes.Based on the analytical findings, strategic policy recommendations were formulated to guide public health programming. These included standardizing maternal health training across rural facilities, scaling community outreach to drive antenatal consultation uptake, strengthening emergency referral infrastructure, and expanding monitoring frameworks to encompass broader health indicators in future evaluations.
Project
Multinomial Logistic Modeling, Epidemiological Feature Selection, and Interpretable Machine Learning: An R-Based Analysis of Physical Activity and Depression Stratification
This project executed an epidemiological data analysis and categorical regression modeling pipeline in R to evaluate the relationship between physical activity, socioeconomic covariates, and depression severity levels across a large-scale population dataset ($N \approx 10,000$).The analytical workflow involved collapsing a 4-category depression scale into a consolidated 3-tier outcome variable ("None", "Some", "Many") by merging sparse upper categories ("Majority" and "Almost all"). Addressing a high-dimensional feature space (~75 candidate covariates), predictor selection was guided by clinical literature and domain plausibility—focusing on physical activity indicators, sleep patterns, and socioeconomic determinants—rather than simple bivariate correlations.Using a baseline-category logit framework with "None" as the reference group, a Multinomial Logistic Regression model was fitted to estimate log-odds and exponentiated odds ratios ($OR$) with corresponding 95% confidence intervals. Non-significant predictors were iteratively pruned to yield a parsimonious, highly interpretable model. Finally, the multinomial model's classification performance and goodness-of-fit were benchmarked against a tree-based machine learning baseline (Random Forest) to evaluate the trade-off between predictive accuracy and clinical interpretability.
Project
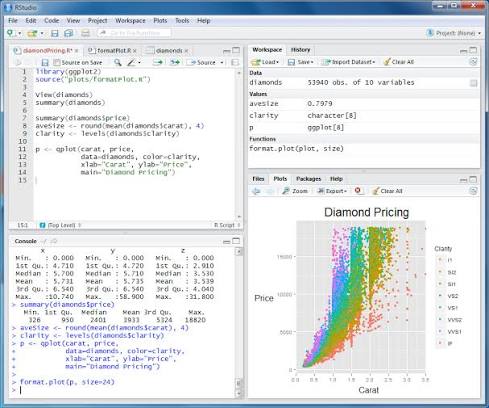
Automated Data Ingestion Pipelines, Web Scraping, and API-Driven Telemetry Harvesting: An R-Based Programmatic Data Collection Framework
This project engineered a scalable, programmatic data collection and extraction pipeline using R to automate the ingestion of multi-source structured and unstructured data. Utilizing packages within the tidyverse ecosystem—alongside rvest for HTML DOM parsing, httr/httr2 for RESTful API interactions, and jsonlite for nested payload parsing—the pipeline systematically harvested, transformed, and validated web-based datasets. To overcome dynamic web structures and network bottlenecks, custom error-handling routines using tryCatch, rate-limiting throttles, and automated pagination handling were implemented. Extracted raw data streams were sanitized using pattern matching (stringr), wrangled into tidy relational formats using tidyr and dplyr, and audited for schema integrity before export. The resulting automated workflow established a reproducible foundation for downstream statistical modeling and empirical research.
Project
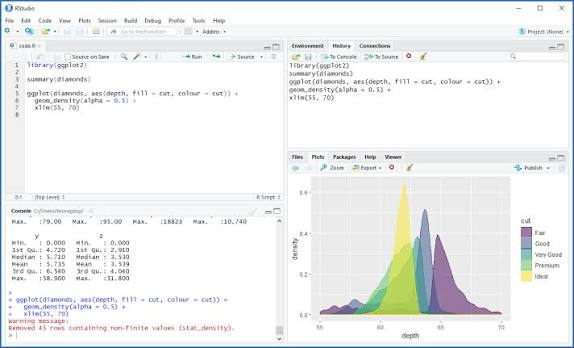
Deterministic ODE Epidemic Modeling, Next Generation Matrix Analysis, and Age-Targeted Vaccine Strategy Optimization: An R-Based Dynamic Transmission Assessment of Respiratory Pathogens
This project executed a deterministic compartmental Ordinary Differential Equation (ODE) modeling and simulation study using R and the odin framework to evaluate epidemic dynamics and vaccine intervention strategies in an age-stratified population (children vs. adults). The model incorporated disease severity tiers (mild vs. severe hospitalizations), age-specific clinical profiles, and imperfect vaccine protection mechanisms.The mathematical analysis derived the Next Generation Matrix (NGM) in base R to compute age-specific transmission probabilities and solve for the basic reproduction number ($R_0$). Long-term epidemic trajectories were evaluated by relaxing the assumption of lifelong immunity, simulating endemic equilibrium dynamics under varying waning immunity durations (100 to 1,000 days). To support model calibration, a likelihood framework (Poisson/Negative Binomial) was formulated to link predicted incidence to catchment-level hospital surveillance data.Furthermore, dynamic simulation studies were conducted to optimize public health outcomes under resource-constrained conditions. By evaluating non-linear trade-offs between rollout timing, daily administration capacity, and coverage limits, the analysis identified optimal age-targeted allocation strategies for a fixed vaccine supply (70% population coverage) to maximize health impact and minimize severe hospitalizations. Finally, the project synthesized quantitative findings into decision-ready executive presentation materials and benchmarked results against published RSV age-specific hospitalization literature.
Project
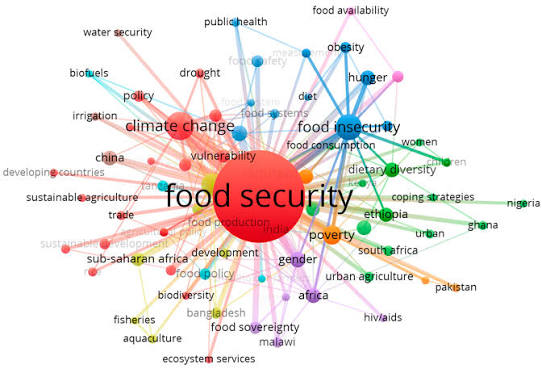
Socio-Ecological Systems Analysis, Non-Parametric Econometrics, and Predictive Regression Modeling: Evaluating Indigenous Knowledge Systems (IKS) for Climate Resilience and Food Security in Dowa District, Malawi
This project delivered an end-to-end SPSS quantitative data analysis, empirical interpretation, and policy synthesis for Chapters 4 and 5 of a Master’s thesis on climate adaptation and food security in Malawi. The empirical study evaluated survey data collected from $N = 382$ smallholder farming households in Traditional Authority Mponela, Dowa District, investigating how Indigenous Knowledge Systems (IKS)—specifically local seed selection, traditional food preservation, weather forecasting indicators, and native farming practices—enhance smallholder climate resilience and household food security.The analytical pipeline executed in IBM SPSS Statistics (v28) followed a rigorous 8-step methodology:Data Sanitization & Demographic Profiling: Analyzed structural attributes (age, gender, education, land tenure, extension contact) using frequency matrices and central tendency metrics.Psychometric Reliability Analysis: Validated internal scale consistency across all four IKS constructs using Cronbach’s alpha ($\alpha = 0.78$ to $0.897$), confirming high measurement reliability without requiring item reduction.Composite Index Construction: Computed standardized Likert scale composite indices to rank community usage and strategic support across IKS domains.Normality Testing: Applied the Shapiro-Wilk test, revealing significant non-Gaussian distribution across all indices ($p < 0.001$), which dictated the use of non-parametric inferential statistics.Bivariate Correlation Analysis: Calculated Spearman rank-order correlation coefficients ($\rho$) to quantify inter-system relationships, establishing strong statistical co-dependencies between traditional weather forecasting, seed diversification, and food storage ($\rho = 0.346$ to $0.520, p < 0.01$).Multiple Linear Regression Modeling: Verified diagnostic assumptions (linearity, homoscedasticity, Cook's distance outliers, and multicollinearity via VIF metrics bounded between 1.060 and 2.883). Estimated an OLS regression model predicting the adoption of indigenous agricultural practices ($R^2 = 0.723, F(6, 336) = 145.837, p < 0.001$), identifying food preservation ($\beta = 0.428$) and seed diversification ($\beta = 0.387$) as primary adoption drivers.Theoretical Framework Synthesis: Integrated empirical outputs into the Sustainable Livelihood Framework (SLF) and Social-Ecological Systems (SES) theory to explain local asset accumulation and adaptive capacity.Policy Strategy Formulation: Synthesized Chapter 5 findings into actionable policy recommendations for the Ministry of Agriculture, extension networks, and NGOs to formalize IKS integration within national climate adaptation policies.
Project
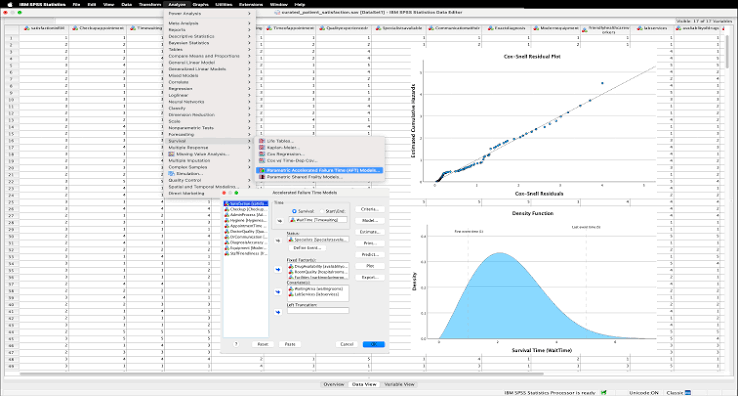
Quantitative Evaluation of Urban Governance Determinants on Public Health Accessibility: An SPSS Empirical Analysis of Kibera Informal Settlement, Nairobi
This project delivered comprehensive statistical data analysis and econometric evaluation for Chapters 4 and 5 of a Master’s thesis research project at The Catholic University of Eastern Africa (CUEA) by Simon Owuor (MA in Regional Integration). The empirical study investigates how four core dimensions of urban governance—policy implementation, resource allocation, transparency and accountability mechanisms, and community participation—statistically influence equitable access to public health services within the Kibera informal settlement in Nairobi, Kenya.Using IBM SPSS Statistics, the analysis processed primary survey telemetry collected from a representative sample ($n = 382$ residents) alongside qualitative data from key informant interviews ($n = 20$) and spatial proximity buffers. The data processing pipeline began with rigorous data cleaning, missing value imputation, and Likert-scale variable transformation. Scale internal consistency and construct reliability were validated using Cronbach’s alpha ($\alpha$). Descriptive statistical techniques—including frequency distributions, measure of central tendency (mean scores), dispersion (standard deviation), and cross-tabulations—were generated to map demographic profiles and spatial-access barriers.Inferential statistical modeling was conducted to test the research questions and underlying hypotheses. Parametric assumptions were verified prior to model fitting, including tests for normality, linearity, homoscedasticity, and multicollinearity using Variance Inflation Factor (VIF) metrics. Bivariate correlation analysis (Pearson's $r$ / Spearman's $\rho$) quantified linear relationships between governance indicators and health service accessibility dimensions (geographical proximity, financial affordability, service availability, and care quality). Subsequently, a Multiple Linear Regression model was estimated to quantify the predictive capacity of urban governance pillars on health access equity, identifying key governance bottlenecks such as structural resource misallocation and policy enforcement gaps.In Chapter 5, the statistical output was synthesized into actionable strategic recommendations aligned with Kenya’s Universal Health Coverage (UHC) agenda, East African Community (EAC) regional health integration frameworks, and UN Sustainable Development Goals (SDG 3 and SDG 11). The project established empirical evidence proving that administrative transparency, targeted resource distribution, and non-tokenistic community engagement are critical prerequisites for mitigating health disparities in high-density urban informal settlements.
Project
Geospatial Market Survey Analysis, Multi-Criteria Location Scoring, and Catchment Demand Modeling: Strategic Retail Pharmacy Site Selection in Narok County, Kenya
This project executes a quantitative market survey analysis and multi-criteria spatial feasibility study to identify and evaluate optimal micro-locations for establishing a retail community pharmacy in Narok County, Kenya. Addressing spatial inequalities in healthcare access—where a significant proportion of the population travels over 5 kilometers to access primary medical facilities—the analysis synthesized primary market survey data, local demographic distribution, transit foot traffic, competitor density, and public health morbidity profiles across key commercial nodes (including Narok Town CBD, Kilgoris, Ololulung'a, and major transit corridors). The methodology combined empirical field survey data with a Multi-Criteria Decision Analysis (MCDA) framework utilizing the Analytic Hierarchy Process (AHP) to weight location determinants. Core evaluation parameters included commercial accessibility, daily foot/vehicular traffic volume, proximity to anchor health infrastructure (such as Narok County Referral Hospital and private clinics facing frequent stockout pressures), local purchasing power, and regulatory spacing constraints enforced by the Pharmacy and Poisons Board (PPB). Using Huff’s Gravity Model, market catchment trade areas were delineated to estimate probability of consumer patronage and forecast drug demand across prescription medications, over-the-counter (OTC) treatments, and maternal-child health products.Furthermore, bivariate correlation and logistic regression models were applied to survey responses to assess consumer willingness-to-pay, preferred payment channels (M-Pesa vs. cash vs. insurance/NHIF cover), and unmet pharmaceutical demand drivers—specifically treatment gaps in respiratory infections, gastrointestinal illnesses, vector-borne conditions, and non-communicable lifestyle diseases. The resulting composite suitability index ranked candidate micro-locations, identifying high-density transport nodes and strategic clinic adjacent locations in Narok Town as top-tier deployment sites offering maximized financial return on investment (ROI), rapid payback periods, and enhanced community healthcare coverage.

Project
Empirical Quantitative Portfolio Optimization, Risk Econometrics, and Probabilistic Market Modeling: An Analytics Evaluation of ISEQ Equities, Real Estate Assets, and Systematic Market Risk
This project executes an end-to-end quantitative financial analysis and econometric portfolio evaluation using market telemetry ingested from Bloomberg and Yahoo Finance. The empirical study investigates four major equities listed on the Irish Stock Exchange (ISEQ) representing distinct economic sectors—CRH plc (construction materials), Ryanair Holdings plc (aviation), Kingspan Group plc (building technology), and Bank of Ireland Group plc (financial services). Using historical monthly price data, individual asset performance was evaluated through descriptive statistical metrics, expected return vectors, and variance-covariance matrices. Bivariate correlation analysis ($\rho$) and mean-variance portfolio theory (MPT) were applied to construct two-stock portfolio allocations, empirically proving how non-perfect asset correlations mitigate overall portfolio risk while optimizing risk-adjusted returns across market cycles.Extending statistical mechanics to real estate asset valuation, the analysis applied fundamental probability rules (range, complement, addition, multiplication, conditional probability, and mutual exclusivity) to evaluate structural and pricing distributions within a Dublin housing market dataset. Discrete probability mass functions were fitted to bedroom count distributions, revealing a right-skewed concentration around 3–4 bedroom family properties, while outdoor amenities were modeled using binary Bernoulli distributions. Furthermore, house price distributions were evaluated against continuous Gaussian probability density functions to estimate tail probabilities and price threshold intervals, establishing benchmark probabilities for properties exceeding €230,000 versus sub-€220,000 valuations.Addressing theoretical financial frameworks, the project delivers a rigorous critical appraisal of the normal distribution assumption in Modern Portfolio Theory, Value at Risk (VaR), and derivatives pricing via the Black-Scholes model. The evaluation synthesizes empirical market anomalies—such as severe leptokurtosis (fat tails), negative skewness, and volatility clustering—that violate Gaussian assumptions during Black Swan market shocks. The critique highlights the failure of linear Gaussian models to capture severe drawdown events and explores advanced financial econometrics, including Student's t-distributions, heavy-tailed extreme value theory, and Generalized Autoregressive Conditional Heteroskedasticity (GARCH) time-series modeling for dynamic volatility tracking.Finally, the project conducts an empirical asset pricing analysis evaluating single-stock price behavior relative to broad market benchmarks. Using daily historical market data, Apple Inc. was evaluated against the S&P 500 index baseline through ordinary least squares (OLS) linear regression. The analysis established descriptive location and dispersion metrics, evaluated market co-movement via Pearson correlation coefficients, and estimated systematic risk ($\beta$) to quantify the stock's sensitivity to macroeconomic index fluctuations. This multi-part analysis bridges theoretical corporate finance, quantitative portfolio construction, and applied econometrics for sophisticated investment decision-making.

Project
Corporate Enterprise Resource Planning (ERP) Upskilling: Microsoft Dynamics 365 Business Central & Analytics Integration for Banking Professionals
This project encompasses the end-to-end design and delivery of a specialized corporate technical training program centered on Microsoft Dynamics 365 Business Central for banking and financial sector professionals. Serving as a lead corporate instructor, the objective was to upskill banking teams on leveraging enterprise-grade ERP architecture, automating core financial workflows, and connecting operational databases to external analytics and reporting ecosystems. The core curriculum covered full-lifecycle navigation and management within Dynamics 365 Business Central, focusing on module workflows critical to banking operations. Key functional areas included General Ledger management, Cash & Bank Management, automated bank reconciliation routines, fixed assets, multi-currency handling, and audit trail validation. Participants were trained on structural data entry, dimension tagging for granular cost-center tracking, and internal control frameworks designed to ensure compliance and financial integrity. Beyond base ERP administration, the program emphasized advanced data integration and business intelligence connectivity. Participants were instructed on building live data pipelines using Power BI, leveraging native Business Central web services and OData endpoints to generate interactive executive dashboards, risk monitoring visuals, and real-time operational reports. Additionally, the training covered bidirectional spreadsheet integration—including the "Edit in Excel" functionality, OData feed connections to Microsoft Excel and Google Sheets, and automated reporting templates—enabling staff to perform rapid data ingestion, bulk adjustments, and streamlined financial auditing without compromising underlying database rules. By translating complex ERP architecture into practical operational workflows, this initiative equipped banking professionals with the technical competency to optimize daily financial processing, eliminate manual spreadsheet redundancies, and deploy data-driven decision tools across corporate banking operations.
Project
Econometric Modeling of Residential Property Valuations: Ordinary Least Squares Regression Analysis of the South Atlantic Housing Market
This project conducts an applied statistical and econometric evaluation for D. M. Pan National Real Estate Company to determine the predictive validity of residential square footage on property listing prices. Focusing on the South Atlantic real estate market—a geographically diverse and high-growth region encompassing Florida, North Carolina, South Carolina, and Georgia—the analysis evaluates whether a single-variable ordinary least squares (OLS) linear regression model provides a reliable, data-driven benchmark for real estate pricing strategies and valuation advisory.Using simple random sampling generated via Excel, a representative sample of $n = 50$ property transactions was drawn from a 2019 regional housing dataset. Exploratory data analysis revealed that both listing price ($y$) and square footage ($x$) exhibit right-skewed distributions, with sample metrics elevated above national baselines ($\$414,340$ sample mean vs. $\$342,365$ national mean for price; $2,417$ sq ft vs. $2,111$ sq ft for home footprint). Bivariate scatterplot inspection confirmed a strong, positive linear association without non-linear curvature. High-leverage coastal Florida listings exceeding $4,000$ square feet were audited for influence and deliberately retained to maintain authentic regional market variance.The fitted OLS linear regression model yielded the prediction equation $\hat{y} = 94,000.80 + 132.5271x$. Statistical evaluation produced a correlation coefficient of $r = 0.9448$ and a coefficient of determination of $R^2 = 0.8926$, proving that home size alone accounts for $89.26\%$ of the total variance in property listing prices across the sample. The model establishes a marginal value increment of $\$132.53$ per additional square foot ($\$13,252.71$ per $100$ sq ft). For a standard $1,500$ square-foot property, the regression equation estimates a baseline listing price of $\$292,791.45$.The empirical findings confirm that square footage serves as a dominant quantitative anchor for residential property pricing in the South Atlantic region. While the uncaptured $10.74\%$ of price variance reflects micro-location quality, property age, and interior condition, the model provides real estate professionals with an objective, empirical framework for setting competitive listing prices, reducing subjective valuation bias, and evaluating market comparables.
Project
IoT-Driven Equipment Performance Telemetry and Yield Loss Quantification for Small-Scale Gold Mining Operations
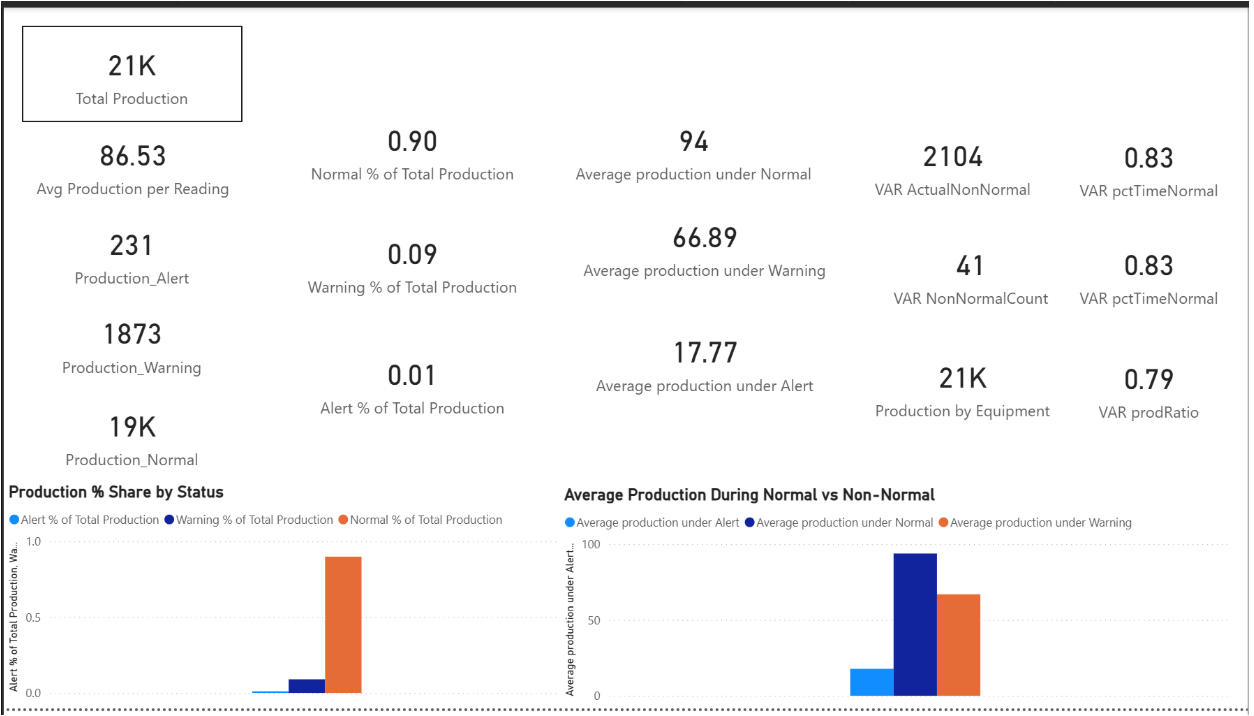
This project delivers a multi-tiered operational telemetry and yield analytics dashboard engineered for Artisanal and Small-Scale Mining (ASM) gold processing operations. Designed to bridge low-level equipment diagnostics with high-level investor risk assessment, the dashboard evaluates real-time performance telemetry across three core operational units: the Retort, Ball Mill, and Shaker Table. The primary objective is to establish an empirical baseline for machine stability, quantify production throughput under variable operating states, and isolate financial yield losses tied to mechanical anomalies and threshold breaches. The diagnostic layer tracks real-time operating behavior using automated thresholding categorized into Normal, Warning, and Alert operating zones. Time-series trend analytics demonstrate that processing units maintain baseline stability within expected operating bands, validating overall production reliability during active monitoring windows. Deep-dive anomaly profiling analyzes event frequencies and temporal clustering to pinpoint operational vulnerabilities. Anomaly breakdown metrics revealed that the Shaker Table recorded the highest frequency of abnormal events due to load-induced vibration sensitivity, whereas the Ball Mill and Retort exhibited strong baseline mechanical stability. Timestamped event logs enable site supervisors to cross-reference performance dips directly with specific operator shifts, ore batch characteristics, or feed rate adjustments. Translating equipment telemetry into financial output, the yield analytics module evaluates production efficiency and quantifies recoverable output. Analysis confirms that over 85% of total processing volume occurs under optimal operating conditions, demonstrating high baseline processing efficacy across all equipment, led by the Retort and Ball Mill. By modeling throughput losses against warning and alert state durations, the dashboard calculates exact volume deficits attributable to preventable downtime. A composite Production Health Score aggregates system-wide stability and efficiency into a standardized metric for rapid evaluation. Ultimately, this analytical solution transforms raw IoT equipment streams into actionable financial insight. By demonstrating that operational risks are localized and recoverable through targeted mechanical stabilization, the platform establishes clear ROI pathways for capital allocation and yield optimization in ASM enterprises.

Project
Biostatistical Analysis of Trauma-Induced Transference Dynamics: A Mixed-Methods Survey of University Cohorts in Kenya
This project provides an analytical and biostatistical evaluation examining the psychological and behavioral consequences of domestic violence exposure among university students across Kiambu County, Kenya. Utilizing a mixed-methods cross-sectional research design, the study sampled 768 undergraduate students evenly distributed across two academic institutions: Jomo Kenyatta University of Agriculture and Technology and Pan Africa Christian University. The primary analytical goal was to quantify the extent to which exposure to physical, verbal, psychological, and sexual domestic violence predicts emotional dysregulation, interpersonal detachment, and transference behaviors within social and academic settings. Data collection combined structured electronic survey instrumentation with qualitative focused group discussions and key informant interviews to triangulate empirical observations.As the statistical consultant supporting data processing and analysis, the analytical workflow involved end-to-end data preparation, data cleaning, validation, and advanced econometric modeling using R Studio. Data hygiene procedures enforced strict sample balance, removing unconsented or extraneous submissions to maintain a precise analytical cohort ($N = 768$). Survey metrics spanned participant socio-demographics, academic discipline categorizations, direct or indirect domestic violence exposure vectors, emotional response frequencies, and behavioral manifestations. Non-parametric cross-tabulations, internal consistency reliability analyses, and parametric multivariable regression models were executed to evaluate the latent relationship between developmental trauma exposure and young adult transference behaviors.Descriptive findings established that domestic violence exposure is pervasive within the cohort, with over 94% of participants reporting some form of personal experience. Non-physical abuse was the most prevalent, with psychological violence affecting 27.2% and verbal violence affecting 25.7% of respondents, compared to physical (16.0%) and sexual violence (7.3%). Poly-victimization analysis revealed significant co-occurrence across abuse types. Temporally, abuse was concentrated during formative developmental stages: 50.5% occurred during adolescence (ages 13 to 18) and 28.6% during childhood (under age 12), while 12.2% reported ongoing exposure. Cross-tabulation by academic field showed broad dispersion, though Health Sciences (21.5%) and Information Technology (15.1%) represented the largest sub-cohorts.Psychological and behavioral outcomes were evaluated across multiple latent constructs. Frequencies of reported affective distress showed high levels of chronic frustration (62.9% reporting "always"), anger (54.5%), helplessness (49.1%), and internal tension (49.2%). Relational impact analysis indicated that emotional trauma drives both internalizing and externalizing transference behaviors. Internalized manifestations dominated the cohort, characterized by emotional withdrawal and silence (32.8% directed toward self), self-directed aggressiveness (23.8%), and persistent anxiety (11.1%). Externalized behaviors included outward aggression, mood volatility, substance dependency, and relational detachment.Help-seeking behavior analysis highlighted a critical institutional gap. While 52.7% of affected students never accessed support services, those who did relied heavily on formal institutional mechanisms, such as university counselors (27.5%) and independent mental health professionals (21.4%). Qualitative thematic extraction corroborated quantitative findings, confirming that early-life exposure to domestic violence systematically impairs self-regulation and manifests as defensive transference in academic environments. This analysis establishes an empirical foundation for targeted institutional counseling interventions.

Project
Healthcare Operations & Supply Chain Telemetry: SQL Window Functions andtableau Workforce Efficiency Dashboard Suite
This project delivers an end-to-end operational analytics framework designed to evaluate and optimize the workflow efficiency of Material Supply Associates (MSAs) across clinical units at Mount Sinai. MSAs utilize Virtual Manager mobile telemetry systems to perform critical supply chain duties, including par-level counting and stock compliance checks. Hospital inventory locations display extreme dimensional variance, ranging from small 20-bin supply closets to major storage hubs containing over 600 bins. Evaluating performance solely on raw task completion duration introduces substantial bias against associates assigned to larger rooms. To solve this, an enterprise analytics pipeline was engineered to transform, normalize, and contextualize labor telemetry data, culminating in an interactive three-tab Tableau dashboard suite. The data infrastructure begins with an advanced Oracle Data Warehouse SQL view designed to join task event logs with inventory master tables and line-level item scan records using standardized location identifiers. SQL window functions form the mathematical engine of the data pipeline. Specifically, the LEAD window function partitions telemetry records by associate owner and orders them chronologically by task completion timestamps. This enables the automatic calculation of inter-task gap durations (in-between time) across sequential tasks performed on the same calendar day. The pipeline dynamically categorizes these gaps into structured operational buckets: transitions (under 5 minutes), travel (5 to 30 minutes), idle time (30 to 60 minutes), and extended idle periods (over 60 minutes). Standardized performance evaluation required dedicated metric engineering within SQL helper views and custom dashboard calculations. A core efficiency benchmark, Weighted Minutes per Bin, was computed by dividing total task duration by total room bin capacity. This metric evaluates associate efficiency by controlling for assigned room scale rather than unadjusted volume. Additional engineered metrics include scan coverage percentage, non-completion rate tracking (~17.5% across cancelled or incomplete tasks), and scanning velocity (seconds per item scanned). Empirical analysis established a baseline scanning rate of approximately 30 seconds per item end-to-end. This highlighted an operational discrepancy against the previously assumed 5 to 6 second scan time, revealing significant time expenditures in travel, physical evaluation, and system navigation. The Tableau dashboard suite is structured across three functional views for supply chain leadership. The Par Orders Efficiency dashboard features real-time KPI indicators, an unfiltered scatter plot mapping room capacity against task duration to preserve extreme performance outliers for root-cause analysis, and a temporal heatmap (Hour of Day by Day of Week). The heatmap pinpointed operational bottlenecks, showing heavy task concentration and elevator congestion between 7 AM and 10 AM on weekdays. A parameterized trend chart allows executive users to toggle time granularity between daily and weekly views of normalized weighted efficiency metrics, restricted strictly to completed tasks to prevent statistical skew. The In-Between Time Analysis dashboard quantifies non-active shift time using dual-axis visualizations that overlay average gap durations onto maximum gap durations per associate, enabling leadership to distinguish systemic operational delays from isolated incidents. Finally, an unaggregated audit tab provides a drillable table for complete record verification. This system translates raw transactional supply chain logs into actionable operational intelligence.
Project
R-Based Laboratory Turnaround Time Audit and Timestamp Data Quality Assessment for Accident and Emergency Samples at Kenyatta National Hospital
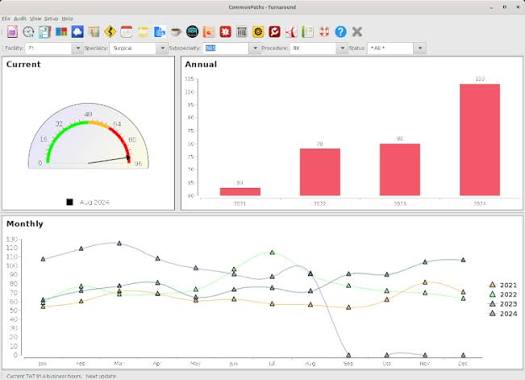
This project comprises a retrospective audit of laboratory sample turnaround times for Accident and Emergency department specimens at Kenyatta National Hospital for June 2025. The work was conducted using data exported from the REDCap electronic data capture system and fully processed in R and RStudio. The primary aims were to quantify stagewise and overall turnaround times where complete timestamps existed, to characterize the distribution of those times against conventional benchmarks, and to systematically document the extent and nature of missing or implausible timestamp data that limit reliable performance measurement. The analysis began with a cleaned dataset of 190 records. Key datetime fields were parsed robustly across multiple formats using the lubridate package, variable names were standardized to lowercase snake_case with janitor, and a set of interval variables was derived in minutes: request to sample collection, sample collection to laboratory registration, registration to result readiness, result readiness to dispatch, and the overall request to dispatch interval. Records lacking the necessary pair of timestamps for any given interval were excluded from that specific calculation, and extreme or negative values were flagged for quality review. Results revealed severe incompleteness of the source data. Only 11 of the 190 records possessed a complete set of timestamps permitting computation of overall request to dispatch turnaround time. Critical fields such as request time and sample obtained time were missing in more than 85 percent of records. Among the 11 complete cases the median overall turnaround time was 105.63 minutes, with a mean of 120.23 minutes and an interquartile range of 92.35 to 132.97 minutes. None of these records met a 60 minute threshold, 72.7 percent met a 120 minute threshold, and all met a 240 minute threshold. Stagewise medians where calculable were 29 minutes for sample to registration, approximately 44 minutes for registration to result, and 13 minutes for result to dispatch; however, these estimates rested on small numbers of observations and were accompanied by extreme outliers, including negative intervals and values exceeding 10 000 minutes, indicating clear data entry errors. Subgroup summaries by patient type and priority flag were produced but remained descriptive only, given the limited sample of complete records. The dominant finding of the audit was therefore not laboratory processing speed in isolation but the profound data quality barriers that prevent continuous, facility level monitoring of turnaround time. High rates of missingness, inconsistent recording practices, and implausible values undermine both the accuracy of calculated intervals and the ability to distinguish genuine operational delays from artifacts of incomplete capture. The project concludes with a set of prioritized, actionable recommendations: enforcement of mandatory timestamp fields at the point of data entry, real time validation rules to reject future dates, negative intervals and format inconsistencies, targeted cleaning of existing extreme values, staff training on consistent timestamp ownership, formal definition of institutional turnaround time targets, and the eventual development of an ongoing monitoring dashboard once data integrity improves. Limitations are explicitly acknowledged, principally the non representative nature of the complete case subset and the presence of residual entry errors requiring manual verification. Taken together, the work demonstrates rigorous application of data cleaning, interval calculation, descriptive statistical summarization, and quality assessment methods in a real world clinical laboratory setting. It supplies both a transparent baseline for the limited number of complete records and a clear roadmap for establishing a reliable, continuous turnaround time surveillance system within the Accident and Emergency laboratory workflow.
Project
Data-Driven Policy Insights for Decarbonizing U.S. Aviation: A Multi-Dataset Analysis Using Python
This project integrates five key datasets to evaluate carbon emissions, fuel costs, subsidies, technological innovation, and carbon tax policy in the U.S. aviation sector. Using Python as the analytical engine, the project uncovers the relationship between government spending, emission levels, and the potential economic impact of introducing or expanding carbon taxation policies. Data Sources & Metrics Analyzed: Carbon Emissions US Civil Aviation emissions (2018–2022) in gigagrams Key trend: 37% drop in 2020 (pandemic) with slow recovery afterward Carbon Tax Policies (by State) California’s carbon tax reached $15.77/ton by 2019 Other states showed minimal or no carbon pricing activity Technological Advancements Aircraft engine specs including SFC (specific fuel consumption), thrust, bypass ratios Useful for assessing decarbonization potential through propulsion upgrades Fuel Consumption and Costs (Domestic vs International) Monthly breakdown from 2018 onward Cost-per-gallon trends used to evaluate economic viability of carbon pricing Federal & State Aviation Subsidies (2018–2023) Billions in annual funding tracked by state and year California and Alaska topped subsidy receipts, yet emission reductions varied Analytical Methods Used (All in Python): Data ingestion & wrangling: pandas, numpy Time series trend analysis and year-over-year comparisons Merging multi-source data (fuel cost + emissions + tax + subsidies) Visualization: matplotlib, seaborn for trend plots and heatmaps Carbon tax modeling: Simulated emission reductions using pricing elasticity assumptions Policy scenario simulation: Impact of a $50/ton national carbon tax on U.S. aviation Key Findings: Subsidies have not proportionally reduced emissions — many states receiving high funding still show inconsistent emission performance. Fuel costs alone do not discourage consumption — low cost-per-gallon correlates with high usage even in high-emission years. Technology investment (based on SFC and bypass ratio) shows promise in reducing long-term fuel dependency. A moderate national carbon tax could reduce aviation emissions by 12–20% over 5 years, assuming gradual elasticity and reinvestment. Skills and Impact Demonstrated: Advanced data merging and multi-source integration Environmental modeling using simulation and cost-emission dynamics Policy analytics: evaluating taxation vs. subsidization strategies Effective use of Python for climate-economic policy modeling Demonstrates how AI and data science can drive green aviation strategies

Project
Hotel Booking Management and Analysis Application in Excel
Hotel Booking Management and Analysis Application in Excel Project Description: This project involved the design and implementation of a complete hotel booking application using Microsoft Excel. The goal was to build an interactive, user-friendly tool to manage room reservations, track occupancy, and analyze hotel performance over time. The solution combines data entry, formula-based automation, and dynamic reporting, demonstrating strong Excel-based modeling and dashboarding capabilities. Key Features and Components: Booking Form Interface Structured form layout using data validation, dropdowns, and conditional formatting for seamless check-in/check-out entry, room selection, guest info capture, and payment details. Automated Calculations Formulas automatically compute duration of stay, total charges based on room type and services used, VAT or taxes, and outstanding balances. Data Validation and Error Checks Ensured only valid inputs (dates, room types, payment status) are accepted to maintain consistency and prevent entry errors. Room Availability Tracker Real-time room inventory updates based on bookings. Availability is calculated using date comparisons and visualized with color codes. Occupancy and Revenue Dashboards Summary tables and charts show: Monthly occupancy rates Revenue by room type or service Average length of stay Seasonal or weekday booking trends Customer Database Maintained guest information and visit history using dynamic named ranges and filtered lists for repeat guest management and reporting. Tools and Techniques Used: Core Excel Functions: IF, VLOOKUP/XLOOKUP, INDEX/MATCH, COUNTIFS, SUMIFS, TEXT functions, DATE/TIME functions Pivot Tables & Pivot Charts for summary reporting Conditional Formatting to flag overdue payments, low occupancy, or overbooked dates Data Validation for drop-downs and controlled inputs Dynamic Named Ranges for table growth and live tracking Basic Macros (optional) for tasks like clearing forms or printing receipts (if implemented) Outcomes and Impact: Provided a low-cost, offline hotel management solution ideal for small hotels or guesthouses without access to enterprise systems. Enabled better decision-making through automated reports on performance and booking behavior. Improved operational efficiency with a centralized reservation and financial tracking system. Limitations: Not suitable for real-time online bookings or multi-user access. Manual entry required unless integrated with advanced forms or VBA. This project highlights advanced Excel modeling skills, data logic design, and the use of spreadsheets as powerful decision-support tools. It demonstrates the ability to translate real-world business needs into structured, functional solutions using foundational data skills.
Project
Educational Research Analytics Using SPSS: A Statistical Investigation of Student Performance and Progress
This project is a complete statistical analysis of high school and college student data using SPSS, conducted for a research course in educational statistics. It explores key relationships among academic performance indicators, demographic variables, motivation factors, and behavioral patterns. The project demonstrates strong proficiency in statistical reasoning, data handling, and research interpretation using real-world educational data. Objective: To conduct an in-depth statistical examination of academic performance (e.g., GPA, math achievement), demographic attributes (e.g., gender, ethnicity, parental education), and psychological factors (e.g., motivation, competence, pleasure), and to identify predictors of educational outcomes using SPSS. Tools & Technologies Used: SPSS: For data preprocessing, visualization, descriptive statistics, inferential statistics, correlation matrices, and regression modeling. Datasets: Two sample datasets were analyzed: hsbdata.sav (high school students) and college student.sav (college students). Key Analysis Components: Data Cleaning & Handling Missing Values Used descriptive statistics and SPSS's missing values analysis Employed mean imputation for missing data to maintain dataset integrity Descriptive and Exploratory Data Analysis Computed central tendency, dispersion, skewness, and kurtosis Used bar charts and stem-and-leaf plots to analyze gender, ethnicity, parental education, and height distributions Central Tendency and Normality Assessment Analyzed mean, median, and mode across variables Checked normality through skewness, kurtosis, and graphical methods Frequency Analysis of Nominal Variables Gender and ethnicity distributions were analyzed to assess representation and balance Findings revealed overrepresentation of certain demographics (e.g., female and Euro-American students) Psychological Variable Analysis EDA conducted on motivation, pleasure, and competence Visual and numerical analysis revealed distribution patterns and skewness Computed Measures Developed a new variable aveEval as an average of four evaluation components Compared with meanEval using SPSS’s MEAN function to highlight effects of missing data Categorical Reclassification Recoded GPA into three performance categories: Low, Moderate, High Created visual frequency tables for GPA classification Correlation Matrix Explored relationships among GPA, study time, work hours, institutional evaluations, and more Found significant correlations between work hours and GPA, and between positive institutional evaluation and GPA Regression Analysis Multiple regression was performed to predict GPA from study hours, work hours, and TV watching Found that none of the predictors significantly explained GPA variation (R² = 10.2%, p > 0.05) Highlighted the complexity of academic performance and the importance of deeper psychological and environmental factors Predictive Modeling of Physical Traits Analyzed correlation between student and same-sex parent height Found a strong correlation (r = 0.842, p < 0.01), confirming hereditary influence Built a regression model with gender and parent height as predictors (R² = 0.748), showing both variables significantly contribute to height prediction Outcomes: Delivered a comprehensive educational research report guided by scientific inquiry and data. Demonstrated mastery of SPSS for statistical modeling, interpretation, and data storytelling. Identified key demographic and environmental predictors of academic and physical traits. Showed ability to handle missing data, recode variables, and interpret multiple statistical outputs. This project highlights the application of quantitative research methods and data-driven insights in the field of education, emphasizing both technical SPSS proficiency and interpretative clarity. It is a strong example of using statistics and data analysis to address complex human-centered questions in academic settings.
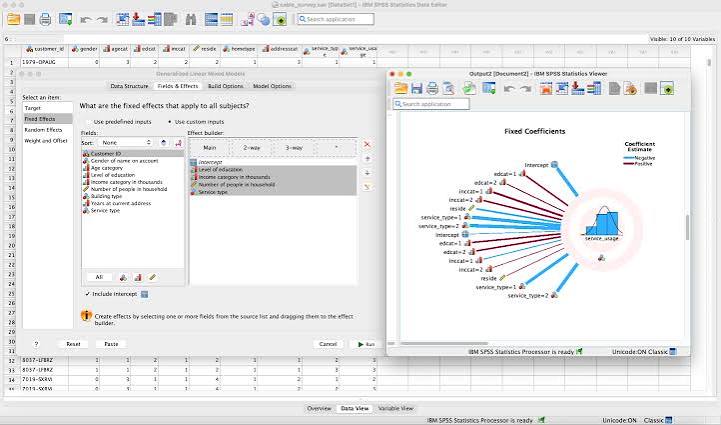
Project
Diabetes Knowledge, Attitudes, and Practices (KAP) Study: Statistical Analysis Using SPSS Among University Students
This project involved a comprehensive analysis of Knowledge, Attitudes, and Practices (KAP) related to diabetes among students at Jomo Kenyatta University of Agriculture and Technology (JKUAT). The study aimed to assess students' awareness of diabetes, attitudes toward its seriousness and preventability, and lifestyle behaviors that influence diabetes risk. Using data collected through a structured Google Forms questionnaire (n = 384), the project applied statistical techniques using SPSS to evaluate both descriptive trends and inferential relationships across demographic subgroups. The analysis applied a structured analytics pipeline aligned with best practices in public health research and statistical modeling. Objectives: Measure students’ knowledge on diabetes symptoms, risk factors, and management Evaluate student attitudes toward diabetes prevention and screening Analyze lifestyle behaviors including diet, physical activity, and smoking Investigate whether demographic factors (age, gender, education, family history) influence diabetes-related KAP Tools and Methodologies: Tool Used: SPSS Study Design: Descriptive cross-sectional Data Source: Self-reported survey using Google Forms Analysis Techniques: Descriptive statistics, bar plots, chi-square tests, binary logistic regression Key Steps: Data Cleaning & Scoring: Recoded responses for binary and Likert-scale items Created composite scores: Knowledge Score: Sum of 24 binary-coded items Attitude and Practice Scores: Mean of Likert-scale responses Binarized outcomes (e.g., Good vs Poor Knowledge) for regression analysis Descriptive Analysis: Explored distributions of demographic variables Visualized knowledge and attitude scores across gender, age, and education groups Found generally high knowledge levels across the student population Chi-Square Analysis: Tested associations between KAP outcomes and demographic factors No statistically significant associations found (e.g., p = 0.308 for gender vs knowledge) Logistic Regression Modeling: Modeled predictors of "Good Knowledge" using demographics Model accuracy = 76.3%, but this was due to class imbalance (dominance of high-knowledge responses) Nagelkerke R² = 0.010: Very weak explanatory power None of the predictors were statistically significant (p > 0.2 for all) Findings and Interpretation: The majority of students (76.3%) had “Good Knowledge” about diabetes Demographic factors (age, gender, education, family history) were not predictive Despite model accuracy, the logistic regression merely reflected dominant class labels Results suggest strong, equitable diabetes awareness among students regardless of background Key Insights: Logistic regression flagged the model's statistical insignificance, yet still offered a valuable insight: that diabetes knowledge is high and uniformly distributed in the population studied Highlights the importance of not relying solely on accuracy as a performance metric when classes are imbalanced This project demonstrates strong skills in health data cleaning, statistical testing, regression modeling, and critical interpretation. It also reflects the ability to distinguish between statistical significance and practical implications, an essential aspect of real-world data analysis in healthcare and education settings.
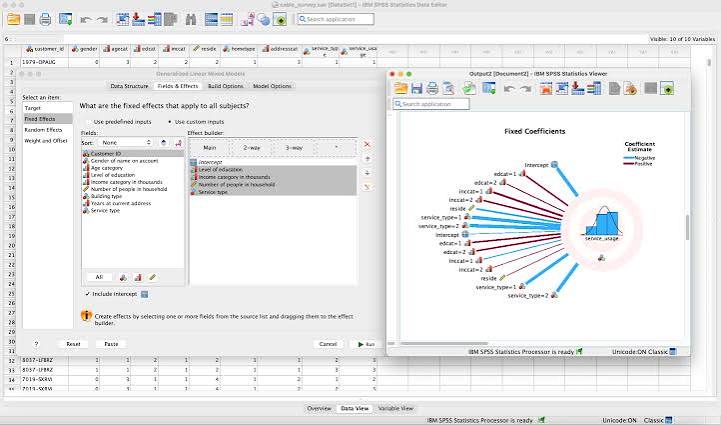
Project
Diabetes KAP Analysis Among University Students: A Public Health Study Using SPSS and Survey Analytics
This project is a data-driven investigation into the Knowledge, Attitudes, and Practices (KAP) related to diabetes among university students at Jomo Kenyatta University of Agriculture and Technology (JKUAT). The study was motivated by the rising burden of diabetes among youth, where awareness and preventive behaviors remain understudied. It involved designing and analyzing a structured KAP survey, applying statistical tests to uncover demographic trends, and drawing insights to inform future health interventions. Objectives: Assess knowledge of diabetes symptoms, risk factors, complications, and management. Evaluate student attitudes toward diabetes prevention and seriousness. Examine behavioral practices (e.g., diet, exercise, screening). Identify demographic influences on KAP outcomes (age, gender, education, family history). Methodology: Study Design: Descriptive cross-sectional Sample Size: 384 students (final valid responses: 354) Data Collection Tool: Structured Google Forms questionnaire Sampling Method: Simple random sampling Analysis Tool: SPSS (Descriptive statistics, Chi-square tests, Binary Logistic Regression) Variables: Dependent: KAP scores (converted to binary/continuous as appropriate) Independent: Age group, gender, family history, lifestyle factors Data Preparation and Scoring: Knowledge items coded as binary (1 = correct, 0 = incorrect/don’t know) Attitude and Practice responses converted to Likert-scale numerical values Composite scores were created: Knowledge_Score (Sum of 24 items) Attitude_Score, Practice_Score (Means of 5-item scales each) Binarization thresholds defined for regression modeling Key Results: Descriptive Analysis: 37% had good diabetes knowledge 28.3% lacked knowledge; 34.7% gave incorrect responses Practices showed variability: 44% reported "very frequent" positive behavior, while 22.4% had minimal engagement Chi-Square Tests: No significant relationships found between KAP categories and demographic factors (all p > 0.05) Logistic Regression: Dependent Variable: Good_Knowledge (0 = Poor, 1 = Good) Predictors: Gender, Age, Family History, Education Level Model Accuracy = 76.3% but driven entirely by class imbalance None of the predictors were statistically significant (p > 0.2), R² = 0.01 Interpretation: Knowledge is consistently high and not significantly influenced by demographic background Conclusions: High awareness levels suggest successful public health messaging, but over 60% still lack correct or complete knowledge, warranting further intervention Attitudes are generally positive, but some variability exists, indicating a need for targeted reinforcement Practices were inconsistent; many students were unsure or not engaged in preventive actions Demographics did not significantly influence knowledge, indicating equitable awareness across groups Recommendations: Enhance awareness programs with actionable behavioral resources Increase engagement with healthcare professionals on campus Promote screening and family history awareness Use multi-channel communication (digital platforms, peer education, university media) to reach diverse student segments This project exemplifies the use of quantitative research methods and SPSS statistical analysis to generate meaningful insights from survey data. It demonstrates skills in research design, variable coding, statistical modeling, and public health reporting, contributing to evidence-based decision-making in student wellness initiatives.
Project
Experimental Data Analysis of Insect Mortality Using Plant-Based Treatments
This project involved the statistical analysis of an experimental insect mortality study to evaluate the effectiveness of various plant-based treatments over time. The goal was to determine which botanical treatments had the highest insecticidal properties and relate mortality outcomes to phytochemical composition. The study illustrates a full data science pipeline — from descriptive analysis to statistical testing and scientific interpretation. Study Design and Objectives: Aim: Evaluate how mortality of insects varies with treatment type and time Treatments: Included essential oils and aqueous extracts of plants like Marigold and Tithonia, along with combination treatments and a control Goals: Compare mortality rates across treatments and time intervals Identify the most effective treatment Investigate the relationship between phytochemical compounds and insect mortality Tools and Statistical Techniques: Language: R (assumed based on author expertise) Techniques Used: Descriptive statistics and time-series plotting for mortality trends ANOVA (Analysis of Variance): to test for significant differences in treatment effects Post-hoc interpretation to rank treatment effectiveness Correlation analysis linking phytochemical presence (e.g., flavonoids, phenols) to mortality outcomes Key Results: Mortality Over Time: Insect deaths increased significantly over time for all treatments 24-hour mortality was low; highest mortality observed at 21 days Control group remained stable, confirming treatment-induced effects Treatment Efficacy: Marigold Essential Oil was the most effective (nearly full mortality at 21 days) Followed by Tithonia Essential Oil Mg + Tithonia mix and control had the lowest mortality ANOVA results confirmed a statistically significant difference among treatments Rate of Action: Marigold acted quickly with high mortality already by 72 hours Most essential oils outperformed aqueous extracts in both speed and total mortality Phytochemical-Mortality Link: Treatments rich in flavonoids and phenols (e.g., Marigold and Tithonia oils) corresponded with high mortality Supports the hypothesis that these compounds contribute to insecticidal activity Conclusions and Recommendations: Marigold Essential Oil is highly effective as a natural insecticide Future studies should isolate flavonoids and phenols to explore their specific mechanisms Aqueous extracts may require concentration or formulation improvement Recommends scaling up the use of phytochemical-rich plant oils in environmentally friendly pest control solutions Skills and Impact Demonstrated: Designed and conducted a full experimental statistical analysis Applied inferential statistics (ANOVA) to real biological data Linked chemical compounds to biological effects via data science Delivered results in a clear, decision-making format for scientific audiences
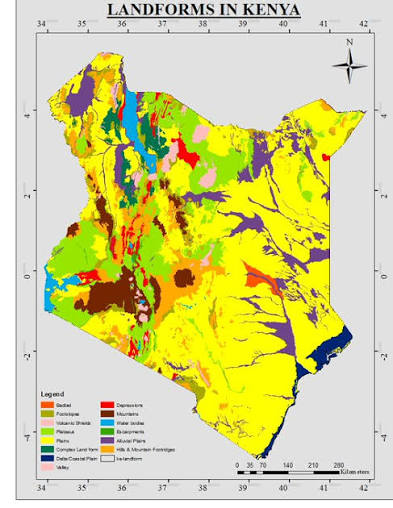
Project
Geospatial Epidemiology of Rift Valley Fever (2006–2007) in Kenya and Tanzania Using QGIS
This project investigated the spatial distribution and outbreak severity of Rift Valley Fever (RVF) across Kenya and Tanzania during the 2006–2007 epidemic. Leveraging Geographic Information Systems (GIS) and QGIS 3.44.0, the study visualized the geographic burden of disease using administrative boundary shapefiles, case data, and city coordinates to build a choropleth map of district-level RVF severity. The result was a robust, policy-informing spatial model for regional outbreak surveillance and intervention planning. Objectives: Analyze the distribution of human and livestock RVF cases across administrative zones Highlight regional hotspots and cross-border transmission zones Demonstrate how open-source GIS tools can support epidemic response and public health planning in resource-constrained settings Data Science & GIS Workflow: Data Preparation & Cleaning (Excel): Converted coordinates from DMS to Decimal Degrees Filtered data for Kenya and Tanzania only Output saved as RVF_Cleaned.csv Geospatial Modeling (QGIS): Imported outbreak data and shapefiles (af_admin_1.shp, 10cities.shp) Used Point-in-Polygon spatial join to calculate case counts per district Symbolized severity using graduated color scales Labeled capitals, added map legend, scale, and north arrow Map Composition: Produced choropleth map highlighting hotspot districts (Garissa, Wajir, Arusha, Kongwa, Kilosa) Visualized both primary and secondary RVF activity zones Included district-level severity scores and city locations for spatial context Key Findings: Severe RVF outbreaks clustered in northeastern Kenya and northern Tanzania, aligning with arid flood-prone zones Environmental triggers (El Niño rainfall, flooding) catalyzed mosquito population booms Pastoral mobility and informal livestock trade likely contributed to cross-border spread RVF cases also appeared in non-endemic areas like Nairobi and Lamu, suggesting behavioral and ecological exposure risks GIS clearly revealed spatially-organized hotspots, supporting the need for localized vector control and public health messaging Strengths & Impacts of the Project: Demonstrated GIS as a decision-making tool for epidemic preparedness Visualized data in a way that is intuitive for both public health experts and policymakers Provided a replicable, open-source spatial epidemiology workflow using QGIS for low-resource settings Skills Demonstrated: Data wrangling and geographic data cleaning in Excel Multi-layered spatial data modeling in QGIS Spatial joins, thematic mapping, and map interpretation Integration of epidemiological concepts with data science and GIS Application of public health informatics in real-world outbreak scenarios Recommendations: Invest in real-time GIS-linked surveillance for vector-borne diseases Train health workers in spatial thinking and geodata literacy Use severity maps to prioritize vaccine deployment, resource allocation, and targeted community education Incorporate climate risk modeling into early warning systems
Project
The Role of Education and Investment in Driving Economic Growth: Econometric Analysis
This project presents a robust econometric investigation into how education expenditure and capital investment influence GDP growth across countries from 2000 to 2021. Using data from the World Development Indicators (World Bank), the study employs panel data analysis and multiple linear regression to evaluate both direct and complementary effects of education, investment, trade openness, and labor force participation on economic performance. Background and Motivation: The project is anchored in the human capital theory, which posits that education improves workforce productivity and innovation. Simultaneously, infrastructure and industrial investments fuel economic capacity and efficiency. By combining these two dimensions with policy-level controls like trade and labor dynamics, this research delivers a holistic model of economic growth determinants in both developed and developing nations. Methodology: Data Source: World Bank’s World Development Indicators (WDI) Time Frame: 2000–2021 Scope: Multiple countries, cross-sectional panel data Dependent Variable: GDP Growth Rate Independent Variables: Adjusted savings on education (proxy for education investment) Gross fixed capital formation (% of GDP) Trade openness (% of GDP) Labor force participation rate Techniques Used: Panel regression modeling (GDP_growth ~ Education + Investment + Trade + LaborForce) Robust standard errors to handle heteroskedasticity Diagnostic checks: VIF for multicollinearity, Breusch-Pagan test, Durbin-Watson for autocorrelation Key Findings: Education spending shows a statistically significant positive effect on GDP growth across countries, supporting the theory that investment in human capital is vital for long-term prosperity. Investment in infrastructure and industry amplifies this effect, especially when paired with a skilled labor force. Trade openness and labor force participation serve as complementary forces, enhancing the impact of education and investment on growth. Diagnostic tests confirmed model robustness, though limitations such as aggregate national-level data and unaccounted governance quality were acknowledged. Visualization & Interpretation: Histograms and scatter plots revealed skewed distributions in education investment and strong but variable associations with GDP growth. The study interprets these variations as outcomes of policy efficiency, institutional frameworks, and differing stages of economic development. Skills and Tools Demonstrated: Cross-country economic modeling with panel data Hypothesis-driven regression analysis using econometric theory Diagnostic testing and result validation Data preprocessing for time-series panel datasets Effective communication of statistical insights to inform economic policy Impact & Application: This study is highly relevant for economists, policymakers, and development strategists seeking to understand the causal pathways between education, capital investment, and national prosperity. It reinforces the importance of efficient education funding and complementary economic reforms to achieve sustainable development goals (SDGs), particularly in human capital and infrastructure.
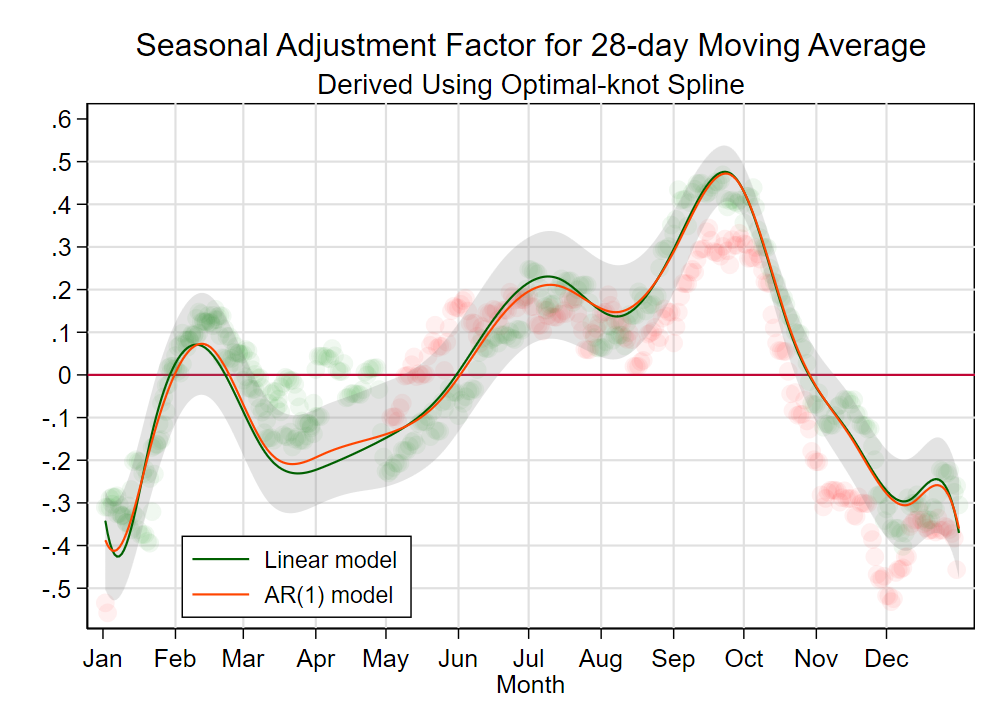
Project
Cross-National Analysis of Income Inequality (2000–2023): Structural Patterns and Policy Implication
This project presents a detailed empirical investigation into income inequality trends across six countries—USA, UK, Germany, India, South Africa, and Pakistan—spanning from 2000 to 2023. Using data from the World Inequality Database (WID), the study explores pre-tax labor income distributions to isolate market-driven disparities, independent of redistributive policy effects. The analysis applies descriptive statistics, regression modeling, and visual analytics to quantify inequality through two indicators: p90p100: income share held by the top 10% pall: income distribution across the entire population Objectives and Scope: Detect global and country-level income inequality trends Examine the disparity between developed and developing economies Assess inequality stability vs. volatility in different institutional contexts Recommend evidence-based policy interventions Tools and Methods Used: Data Source: World Inequality Database (WID) Statistical Software: STATA Techniques Applied: Linear regression modeling with robust standard errors Histograms and time-series visualization of income shares Diagnostic tests: residual plots, Shapiro-Wilk, and VIF Variables: Income shares (p90p100, pall) Country-specific alternate measures (e.g., usa2, uk2) Key Findings: Developed Economies (USA, UK, Germany): Relatively stable inequality, with marginal increases in top 10% shares. Top 10% income share ranges: USA: ~42% UK: ~36% Germany: ~32% Developing Economies (India, South Africa, Pakistan): Exhibit persistently high and volatile inequality. South Africa shows the highest concentration, averaging 55% of national income among the top 10%. Cross-Country Observations: Disparities in trends signal the impact of structural factors, including: Weak labor markets Informal economies Limited access to quality education and healthcare Policy Recommendations: For Developed Nations: Enhance progressive taxation Strengthen middle-income wage growth policies For Developing Nations: Invest in education, healthcare, and formal labor markets Improve institutional capacity and governance Foster inclusive economic participation Globally: Promote international financial transparency Adopt cooperative frameworks to address wealth concentration and capital flight Skills Demonstrated: Econometric modeling and diagnostics Cross-country comparative analysis Data cleaning and standardization Interpretation of income distribution metrics Policy formulation based on empirical findings Relevance and Impact: This project underscores the urgent need to address structural inequality through data-driven, country-specific policies. It contributes to ongoing global discussions on economic justice, development, and social cohesion, and provides a robust analytical foundation for economists, policymakers, and development agencies working toward inclusive growth.
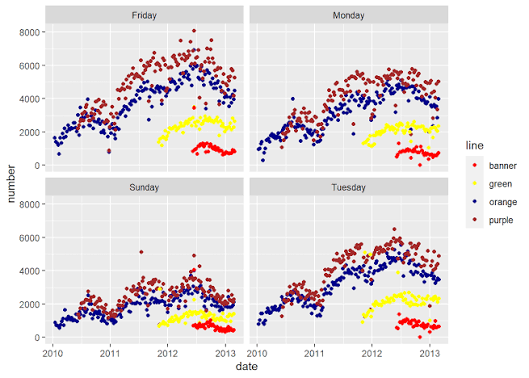
Project
Statistical Analysis (General)
STAI-NASA-TLX Project Project Overview: The "STAI-NASA-TLX" project evaluates state anxiety and cognitive load among nursing learners during simulation-based learning (SBL) sessions. Using the State-Trait Anxiety Inventory (STAI) and the NASA Task Load Index (NASA-TLX), this study measures the effectiveness of mindfulness-based activities (MBAs) in reducing anxiety and cognitive load. Key Features: Data Collection: Data was collected from nursing learners both before and after the intervention. Collected data included self-reported anxiety levels and cognitive load across dimensions such as mental demand, physical demand, temporal demand, performance, effort, and frustration. Reverse Scoring and Total Calculation: STAI responses were reverse scored where necessary, and total scores for both pre- and post-intervention were computed to assess anxiety levels. Descriptive Statistics: Detailed descriptive statistics for NASA-TLX subscales were provided, offering insights into cognitive load experienced by learners during SBL sessions. Inferential Statistical Analysis: Paired t-tests and Wilcoxon Signed-Rank Tests were performed to compare pre- and post-intervention scores. Effect sizes were calculated to determine the practical significance of observed changes. Correlation Analysis: The relationships between changes in STAI scores and NASA-TLX subscales were explored to understand the interaction between anxiety and cognitive load. Visualizations: Various visualizations, including histograms, Q-Q plots, box plots, and scatter plots, were generated to illustrate the data distribution and relationships. Technologies Used: R Programming Language: Utilized for data manipulation, statistical analysis, and visualization. Libraries: Packages such as ggplot2, dplyr, and stats were key in executing the analyses and generating visualizations. Project Outcome: The project provided significant insights into the efficacy of mindfulness-based activities in reducing anxiety and cognitive load among nursing learners. These findings contribute to improving nursing education through evidence-based interventions, potentially enhancing clinical reasoning, judgment, and overall learner performance in clinical settings. Attachments: Visualizations: Including but not limited to STAI-NASA-TLX correlations, box plots, histograms, and Q-Q plots. CSV Files: Detailed results such as STAI t-test results, NASA-TLX descriptive statistics, and correlation analysis data. This project showcases the critical role of MBAs in managing cognitive load and anxiety, ultimately contributing to better educational outcomes and preparedness in nursing education.

Project
BREAST CANCER CLINICAL AUDIT
Breast cancer is still one of the most pressing public health issues around the world and its burden is increasing whether countries are developed or developing. In Kenya, breast cancer is the most common cancer and a leading cause of cancer morbidity in women, and, as a determinant of cancer mortality more broadly. While there has been increasing awareness and improved access to healthcare in recent years, issues with delayed presentation, inadequate documentation, and non-adherence to clinical guidelines, still undermine efforts at properly managing breast cancer. Clinical audits are effective tools for assessing current clinical practices, identifying gaps in care and helping to make evidence-based changes. Kindly remember that Kenyatta National Hospital (KNH) is a national referral and teaching hospital, and they have a complicated volume of breast cancer patients that requires continuous re-evaluation and monitoring of diagnostic accuracy - whether clinical decisions made by the medical staff were appropriate, and the quality of documentation as well. It also enables everyone involved with the clinical process to have an understanding of the lived experience of patients - from history taking, physical examination, diagnostic imaging, and ultimately decisions about treatment according to current clinical guidelines - in getting closer to translating or transferring clinical practice to their professional responsibilities. This report represents a thorough audit of breast cancer practices at KNH using prospectively collected data. It seeks to assess whether the documentation is complete, whether initial presentations are assessed appropriately, and whether discharge planning demonstrates continuity of care. The audit also provides insights that can be acted upon to strengthen breast cancer care at the hospital by illuminating patterns and gaps.
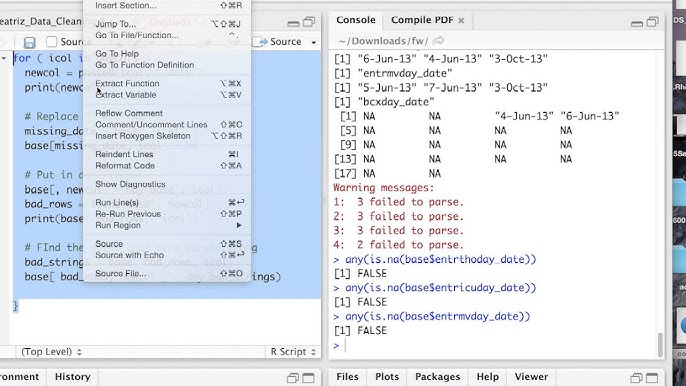
Project
Comprehensive Data Analysis and Visualization in R: Cleaning, Preprocessing, and Statistical Insight
This project showcases a complete data analysis pipeline executed entirely in R, focusing on structured data cleaning, preprocessing, transformation, statistical exploration, and visualization. It is designed to simulate a real-world analytical workflow, commonly applied in health, business, and social science domains. Project Objective: To transform a raw dataset into a clean, well-structured, and analysis-ready format; to conduct meaningful descriptive and inferential statistical analysis; and to present the findings visually using reproducible R workflows. Tools and Packages Used: Core R tidyverse (dplyr, tidyr, ggplot2) lubridate for date-time formatting janitor for cleaning column names and tables gtsummary and gt for statistical reporting and customized summary tables Key Activities and Methodology: Data Cleaning & Preprocessing Inspected structure, types, and missing values Formatted inconsistent date and time entries Removed duplicates, handled outliers, and imputed missing values Recoded categorical variables and standardized measurement units Data Manipulation Grouped and summarized data using dplyr::group_by() and summarise() Applied joins, filters, and reshaped the data using pivot_longer() and pivot_wider() Created derived variables to support custom analysis (e.g., age groups, binary outcomes) Exploratory Data Analysis (EDA) Generated univariate and bivariate summaries Explored distributions, correlations, and key trends using ggplot2 and summary statistics Applied conditional filtering to isolate key segments of interest (e.g., by age, gender, location) Statistical Analysis Conducted hypothesis testing (t-tests, chi-square tests) Computed confidence intervals and p-values for group comparisons Used logistic regression or linear modeling depending on the problem Structured results into publication-ready summary tables using gtsummary Data Visualization Created bar charts, histograms, box plots, scatter plots, and line plots Designed multi-facet and theme-customized plots to highlight differences and patterns Annotated visualizations for stakeholder clarity and interpretation Outcome: Delivered a fully cleaned and transformed dataset ready for advanced modeling or reporting Identified key statistical relationships and group differences Communicated insights through both statistical summaries and intuitive visualizations Conclusion: This project reflects strong proficiency in R programming for data analysis workflows. It demonstrates end-to-end capabilities from raw data ingestion to insight communication, supported by statistical rigor and clean, reproducible code. The methods used align with best practices in public health research, business analytics, and academic reporting, making the work adaptable across various domains.

Project
Hospital Mortality Audit and Clinical Review Using REDCap: Internal Medicine Department – March 2025
This project involved designing and deploying a REDCap-based mortality audit tool to collect and analyze structured clinical data for all patients who died within the Internal Medicine Department at a tertiary hospital in March 2025. The audit was part of a hospital-wide quality improvement initiative aimed at identifying preventable deaths, delays in clinical care, and patterns in acute deterioration. Project Objectives: To document and analyze demographic, admission, and clinical intervention data for all in-hospital deaths To identify delays in medical reviews and the impact of early vs late intervention To classify the causes of death and assess preventability To use standardized REDCap data collection for future comparability and audit cycles Tool Used: REDCap (Research Electronic Data Capture) – designed a structured data entry form with 30 fields, including branching logic, datetime formatting, and validation rules Key Data Components Collected: Patient Identification & Admission Data IP numbers, ward/bed assignments, age, sex Admission source (e.g., emergency, referral) Admission date and time Ward Assignment & Clinical Management Primary ward and attending consultant Initial and final medical review timestamps Any delays in medical review, with qualitative justification Vital Signs and Clinical Indicators Blood pressure, heart rate, respiratory rate, oxygen saturation Glasgow Coma Scale (GCS), random blood sugar levels Critical Interventions & Transfers Date/time of major events (e.g., CPR, intubation) ICU/HDU transfers and dates (if applicable) Outcome Documentation Final status at discharge (Recovered, Transferred, Deceased) Cause of death Whether the death was deemed preventable Whether a family meeting was held Highlights of Data Quality and Audit Design: Branching Logic: Certain fields (e.g., ICU transfer date, delay reasons) only appear conditionally Validation Controls: Numeric and datetime validations to improve data integrity User Roles: Designed for research assistants and clinicians with appropriate REDCap access Ethical Considerations: Data structured for retrospective analysis with built-in confidentiality safeguards Outcome and Insights: Built a replicable, audit-ready REDCap form enabling structured mortality audits across departments Supported downstream statistical analysis (e.g., preventability rates, delay impact, clinical response timelines) Enabled hospital leadership to review avoidable mortality and initiate service improvements Prepared the dataset for linkage with future clinical dashboards or mortality review panels This project reflects hands-on experience with clinical audit design, REDCap implementation, and hospital data governance. It demonstrates your ability to translate clinical workflows into structured digital audits, enabling data-driven quality improvement in hospital medicine.

Project
Clinical Audit and Risk Stratification in Toxic Epidermal Necrolysis (TEN)
This project was a clinical audit conducted at Kenyatta National Hospital (KNH) to evaluate the presentation, risk profiles, management, and outcomes of patients diagnosed with Toxic Epidermal Necrolysis (TEN) in March 2025. TEN is a rare but critical dermatological emergency, commonly drug-induced, with high rates of morbidity and mortality. Using REDCap for structured data capture and R Studio for data cleaning, visualization, and statistical analysis, this project assessed 19 confirmed TEN cases to uncover actionable insights for clinical improvement, focusing on severity scoring (SCORTEN), drug causality, complications, and outcome prediction. Objectives: Describe demographic and clinical patterns in TEN patients Identify commonly implicated drugs Evaluate outcomes based on SCORTEN scores and comorbidities Investigate complications and interventions used Propose data-driven recommendations for clinical protocol enhancement Methods & Tools: Study Design: Retrospective clinical audit Data Source: REDCap-based collection of 19 de-identified patient records Tools Used: R (tidyverse, janitor, ggplot2) for cleaning, visualization, and analysis REDCap for structured clinical data entry Variables Analyzed: Age, sex, BSA involvement, drug exposure, comorbidities (e.g., HIV, DM), SCORTEN score, interventions, and outcome Key Findings: 📌 Demographics & Presentation Median age: 29 years (range: 1–44); TEN affects even young adults Gender distribution: Balanced; no strong sex-based predisposition Classical TEN features: Widespread erythema, blistering, mucosal involvement 📌 Causative Drugs Most implicated: Antibiotics (sulfonamides, penicillins) and anticonvulsants (phenytoin, carbamazepine) Minor cases involved NSAIDs and antivirals 📌 SCORTEN & Risk Stratification Higher SCORTEN scores (>3) were strongly associated with mortality HIV-positive patients had notably worse outcomes SCORTEN confirmed as a valuable predictive tool for triage and ICU referral 📌 Complications Most common: Infections (due to skin barrier loss), ocular damage, GI bleeding Visual complications pose long-term risks Complication rates correlated with higher SCORTEN and late presentation 📌 Management Practices Standard supportive care included IV fluids, analgesia, wound care IVIG and systemic corticosteroids used variably; early administration linked to better outcomes Highlighted need for standardized TEN protocols 📌 Outcomes Most patients survived; fatalities were tied to SCORTEN >3, HIV, and BSA >30% Older non-survivors noted, but age alone wasn’t a dominant predictor Mortality partly preventable with earlier escalation to ICU and aggressive care Recommendations: Systematic SCORTEN scoring at admission for all suspected TEN cases Strengthen drug allergy documentation and risk screening Standardize TEN care protocols including early use of IVIG/steroids Enhance access to multidisciplinary teams (dermatology, ophthalmology, ICU, ID specialists) Institutionalize regular mortality audits using tools like REDCap + R Impact: This audit demonstrated the value of structured clinical data collection and statistical analysis in improving care for rare, high-risk conditions. It showcases your ability to: Design and execute a hospital-based clinical audit Integrate REDCap and R for meaningful clinical insights Interpret risk models (SCORTEN), visualize outcomes, and recommend systemic improvements
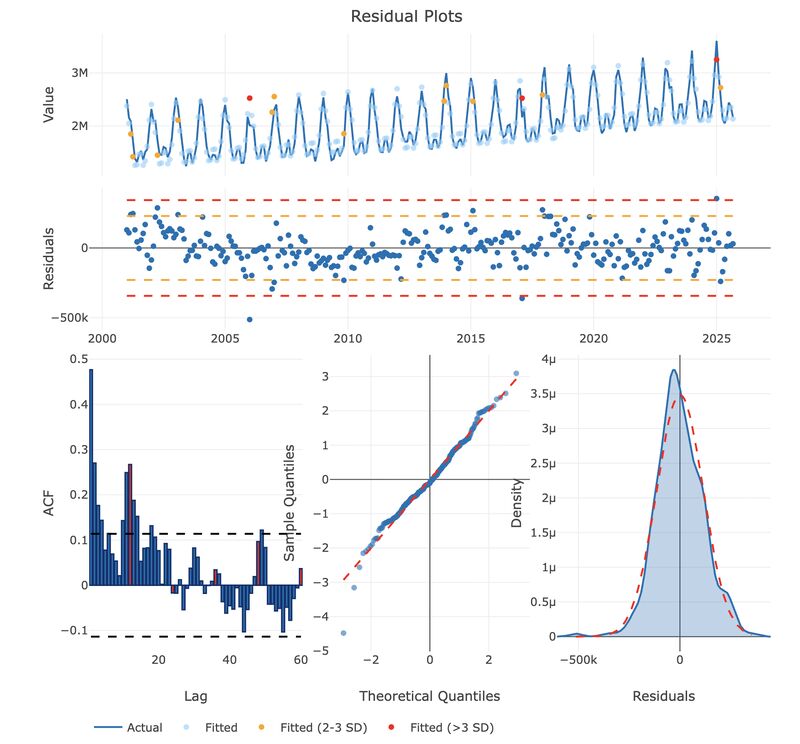
Project
Public Health Data Analysis on Foodborne Disease Risk Factors Using R
This project analyzes self-reported data on foodborne illness among individuals, with a focus on identifying demographic and environmental risk factors. The analysis was conducted using R programming with an emphasis on data cleaning, recoding categorical variables, statistical summaries, and structured reporting aligned with public health research standards. Dataset Source: A structured dataset titled ENVIRONMENTALANDSOCI_DATA_2025-06-05_1030.csv, containing responses from a health behavior survey. Variables included gender, religion, education level, water sources, sanitation, and experience with foodborne illness. Tools & Libraries Used: tidyverse for data manipulation and visualization gtsummary for statistical summaries and formatted tables here for consistent file referencing apaTable for APA-style reporting Analysis Objectives: Clean and recode demographic and environmental data for interpretability Describe the population distribution by key factors such as gender, education, religion, and marital status Evaluate associations between water/sanitation factors and reported foodborne illness Present the findings in well-structured Word-ready tables using gtsummary and APA formats Key Steps & Components: Data Cleaning & Recoding Used mutate() and dplyr::recode() to transform coded variables (e.g., gender: 1 → Male, 2 → Female) Handled categorical variables like religion, marital status, education level for clarity Descriptive Statistics Summarized demographic distributions (e.g., majority Christian, mostly educated up to secondary/tertiary level) Generated frequency tables and cross-tabulations for environmental exposure variables Foodborne Illness Assessment Analyzed the proportion of individuals reporting illness Compared illness rates across groups (e.g., by water source, handwashing practices, and food storage) Reporting Produced publication-ready tables using gtsummary::tbl_summary() Report was rendered as a clean Word document with interpretable tables for policymakers or public health officials Outcomes & Insights: Demonstrated correlation between poor sanitation indicators (e.g., unsafe water source) and self-reported foodborne disease Identified key demographic segments for targeted interventions Delivered a professional-quality report using reproducible R Markdown workflows This project showcases your ability to: Conduct public health data cleaning and statistical exploration using R Translate coded survey data into readable, policy-relevant summaries Apply structured R workflows for reproducible reporting
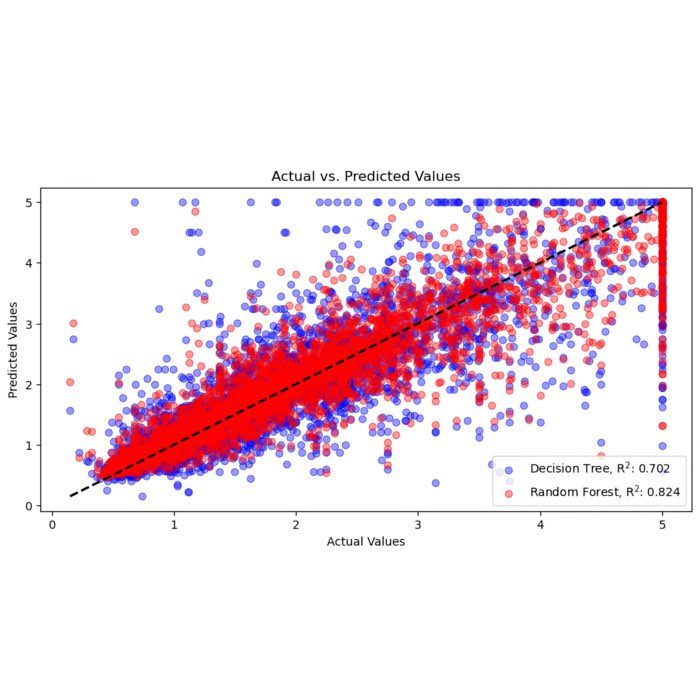
Project
Predicting Customer Satisfaction in Supermarket Sales Using Random Forest Regression
This project applied supervised machine learning techniques to analyze transactional data from a supermarket sales dataset and attempted to predict customer satisfaction ratings. It combined exploratory data analysis, feature engineering, and modeling using Random Forest regression to evaluate the feasibility of forecasting customer sentiment based on sales and operational data. Dataset Source: Kaggle: Supermarket Sales Dataset 1,000 records | 17 features (both categorical and numerical) Objectives: Understand key sales and revenue patterns by branch, product line, and payment method Predict customer satisfaction ratings based on measurable transactional variables Assess which features, if any, strongly influence ratings Tools and Technologies: R Programming (randomForest, caret, tidyverse) Modeling Technique: Random Forest Regression Evaluation Metrics: RMSE, MAE, R² Key Analytical Steps: Data Preparation: Selected predictive features: Unit Price, Quantity, Total, COGS, Gross Income Target variable: Customer Rating (1 to 10 scale) 80/20 train-test split for modeling Modeling Approach: Trained a Random Forest Regression model (100 trees) Evaluated using standard metrics: RMSE: 1.867 MAE: 1.579 R²: 0.00095 (indicating extremely low explanatory power) Visualization & Insights: Explored payment method distributions (Cash, E-wallet, Credit Card) Analyzed sales performance by product line using boxplots Tracked total sales trends across date/time Key Takeaways: Sales metrics alone are insufficient to predict customer ratings Ratings are likely influenced by non-quantitative factors such as customer experience, staff interaction, or brand trust The model struggled to generalize, suggesting a mismatch between available predictors and the complexity of human satisfaction Recommendations: Enrich the dataset with qualitative data such as customer reviews or service feedback Leverage Natural Language Processing (NLP) to analyze textual customer sentiment Explore alternative machine learning approaches, such as: Sentiment classification Customer segmentation Hybrid models combining quantitative and qualitative inputs This project demonstrates your ability to: Apply end-to-end predictive analytics workflows Use Random Forest modeling effectively and interpret its limitations Translate modeling performance into strategic business recommendations Communicate technical findings in an accessible, data storytelling format
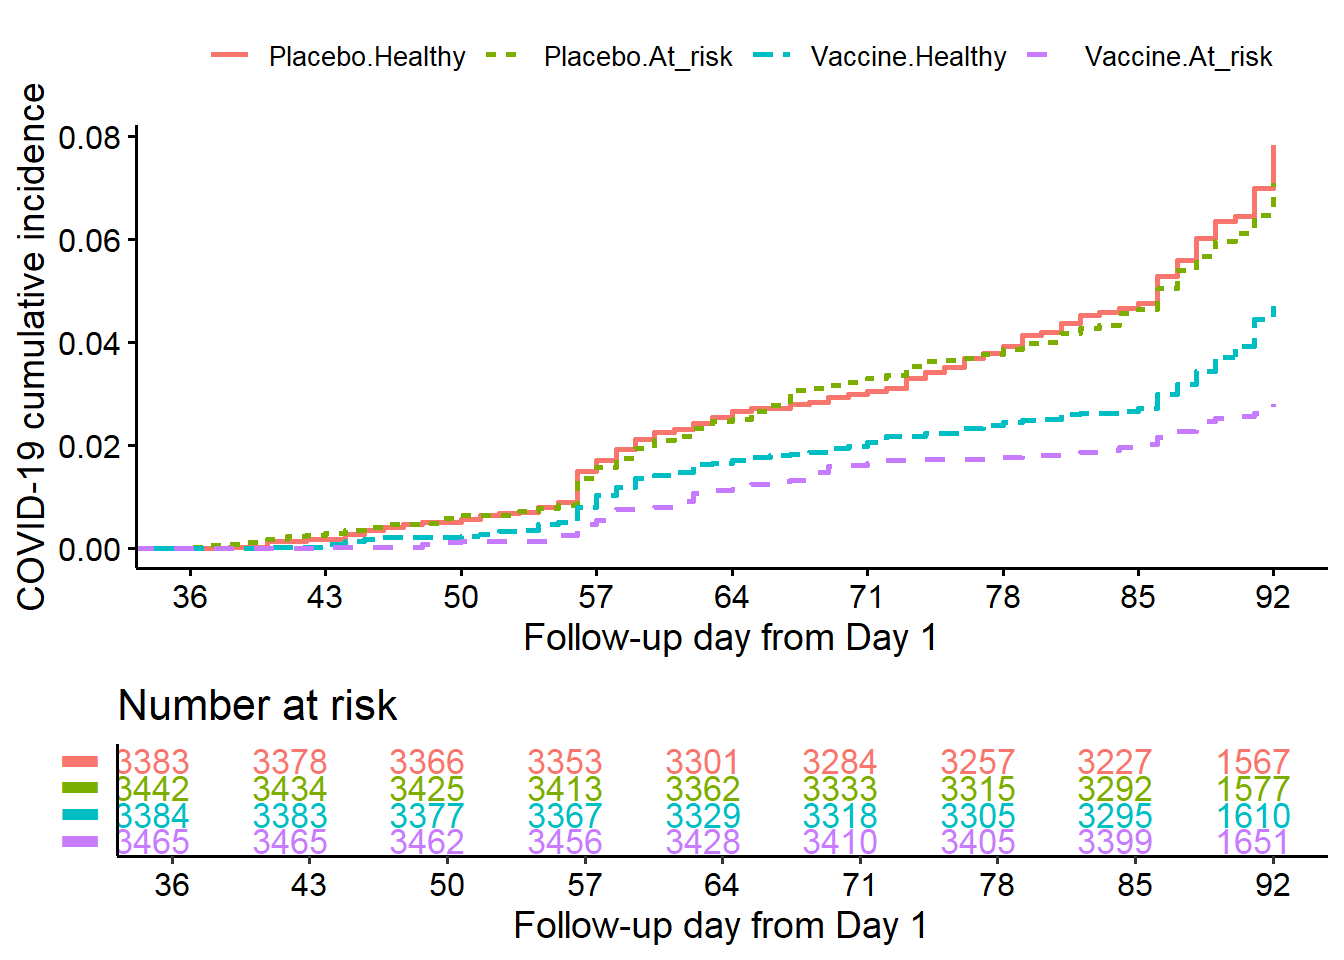
Project
Clinical Audit and Statistical Analysis of Maternal Mortality at KNH
This project presents a retrospective clinical audit and data-driven evaluation of 36 maternal deaths at the High-Dependency/Critical Care Obstetrics Unit (HCQ) of Kenyatta National Hospital. It combined public health analytics, clinical data science, and statistical computing in R to uncover patterns of preventable mortality, focusing on systemic gaps, timeliness of care, and referral quality. The analysis aligns with WHO maternal mortality review guidelines and Kenya’s national frameworks for reproductive health improvement. Data were collected via structured Google Forms, cleaned and processed using the R programming language, and summarized with advanced reporting tools (gtsummary, tidyverse, gt). Objectives: To statistically examine demographic and clinical characteristics of maternal deaths To evaluate referral pathways, delays in care, consultant involvement, and treatment timelines To compare clinical and postmortem findings and assess institutional gaps in documentation and decision-making To offer actionable recommendations based on structured clinical audits Tools and Techniques Used: Language: R (Version 4.4.3) Libraries: gtsummary, janitor, tidyverse, gt Data Source: Google Forms → CSV export Analysis Workflow: Structured data cleaning Exploratory data analysis (EDA) Statistical summaries of causes of death, timelines, delays Stratified tables (demographics, risk assessments, referral sources) Grouped cause-of-death analysis using ICD-based clinical categories Key Findings: Hypertensive disorders and hemorrhagic complications were the leading direct causes of death 55.6% of deaths occurred postnatally, reflecting missed opportunities in postpartum monitoring 75% of patients were referrals, often late and inadequately documented Consultant involvement in critical decisions was low (only 33% during pre-delivery phases) 97% of the deaths lacked completed Maternal Death Review Forms (MDRFs), compromising audit quality Postmortem reports were missing or unavailable in nearly half of the cases Significance in Data Science and Health Analytics: This project exemplifies how data science can bridge the gap between clinical evidence and systemic change in healthcare. By leveraging structured audit data and advanced R workflows, the team translated fragmented clinical records into clear, actionable insights for quality improvement. The audit not only identified patterns in maternal mortality but also modeled a replicable approach for healthcare quality assurance using open-source analytics. Recommendations Generated from Analysis: Standardize antenatal risk assessments and ensure follow-ups for high-risk pregnancies Institutionalize consultant oversight in admissions, deliveries, and escalations Digitize referral protocols and enforce communication with referring facilities Implement mandatory MDRF filing and postmortem documentation for every case Train staff on early warning signs and integrate continuous postpartum surveillance Develop interactive dashboards for internal monitoring and stakeholder feedback Impact & Future Directions: This audit lays the foundation for a data-centric approach to maternal health system reform. Future phases may integrate predictive models to identify high-risk cases earlier, build referral scoring systems, and digitize mortality dashboards for real-time tracking and action.
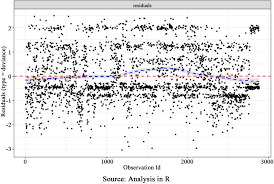
Project
Exploring Trends in HIV Prevalence and Neonatal Mortality in Sub-Saharan Africa (2000–2023)
This project presents a longitudinal, cross-country analysis of two critical public health indicators: HIV burden and neonatal mortality across Sub-Saharan Africa from 2000 to 2023. The study combines publicly available datasets from the World Health Organization and UNICEF/UN IGME, using Python and R to conduct in-depth trend analysis, visualize regional disparities, and explore relationships between disease burden and child survival outcomes. Goals and Scope: Analyze the temporal trends of people living with HIV across African nations, with emphasis on high-burden regions Examine neonatal mortality rate (NMR) trends across wealth quintiles, years, and sexes Explore possible associations between HIV prevalence and neonatal mortality rates using side-by-side analysis and correlation-based exploration Data Sources: HIV Dataset (2000–2023): Indicator: "Estimated number of people (all ages) living with HIV" Country-level data, disaggregated by year and region Extracted from WHO global datasets Neonatal Mortality Dataset (UN IGME Estimates): Indicator: "Neonatal mortality rate per 1,000 live births" Dimensions: Sex, Wealth Quintile, Year Covers Sub-Saharan Africa, sourced from UNICEF and UN IGME Technologies and Methods: Tools: Python (pandas, seaborn, matplotlib), R (ggplot2, tidyverse) Processes: Data wrangling and unification Time-series analysis Grouped summaries by country, region, sex, and socioeconomic group Dual-axis plotting and heatmap visualizations Optional regression or correlation analysis to explore interdependence Key Insights: HIV burden remained critically high in select Sub-Saharan countries despite global treatment efforts; progress varied across nations Neonatal mortality showed an overall decline, but inequities persist across wealth quintiles and demographic groups Preliminary findings suggest a geospatial and developmental correlation between regions with higher HIV burden and persistent neonatal mortality, especially in under-resourced health systems Impact and Value: Builds a scalable, data-driven template for health systems analysis Provides a dual-outcome lens for policymakers, NGOs, and healthcare leaders to understand compound public health vulnerabilities Demonstrates multi-source data integration, health analytics, and longitudinal analysis skills critical for public health data scientists
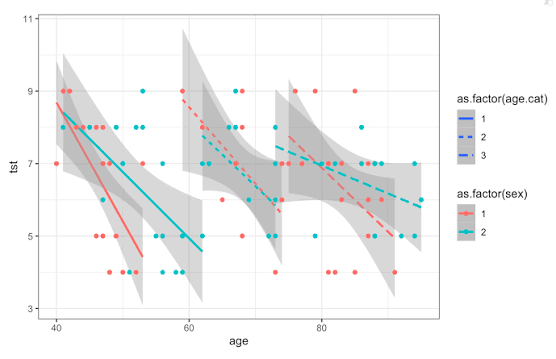
Project
Longitudinal Analysis of Diabetic Foot Disease in Kiambu County: A PhD-Level Mixed-Methods Study
This project outlines a comprehensive data science workflow developed to support a PhD-level clinical study on Diabetic Foot Disease (DFD) across intervention and control sites in Kiambu County, Kenya. It demonstrates robust statistical design and implementation using R programming, integrating baseline and endline assessments, with advanced modeling to evaluate the impact of educational interventions on patient outcomes. Project Goals: Evaluate DFD prevalence and predictors at baseline Assess the impact of a targeted education intervention Quantify the incidence of new DFD cases over time Support evidence-based public health decision-making through reproducible analytics Data Structure: 4 datasets: Baseline and Endline for both Intervention and Control groups Variables include: blood pressure, HbA1c, eGFR, comorbidities, demographic & behavioral factors Analytical Workflow and Techniques: 1. Data Cleaning and Preparation Unified import and structure standardization in R Labeled categorical variables for clarity (e.g., sex, education, residence) Derived key metrics like binary DFD status, CKD stages, and comorbidity indicators 2. Data Integration Merged data on unique patient ID Constructed time and group indicators for repeated measures analysis Ensured matched records for before–after comparison 3. Exploratory Data Analysis (EDA) Summary stats by group and timepoint Visualizations: boxplots, density plots, cross-tabulations Initial identification of risk trends 4. Research Question-Specific Modeling RQ1: DFD Prevalence at Baseline → Cross-sectional analysis + chi-square tests RQ2: Predictors of DFD → Logistic regression (adjusted ORs, interaction terms, multicollinearity checks) RQ3: Effectiveness of Education Intervention → Difference-in-Differences (DID) model → Paired t-tests/Wilcoxon tests → Linear mixed models for clustering effects RQ4: Incidence of New DFD → Poisson/Log-binomial regression for relative risk 5. Advanced Extensions (PhD-Level Depth) Latent Class Analysis for symptom clustering Propensity Score Matching for baseline adjustment Multilevel modeling (site-level effects) 6. Reporting and Documentation High-quality tables with gtsummary, visualizations via ggplot2 Full reproducibility with R Markdown / Quarto Recommendation to publish in peer-reviewed journals Why R Over SPSS? Supports complex longitudinal and multilevel models Allows automation, reproducibility, and customization Better suited for publication-ready graphics and robust workflows Skills and Value Demonstrated: Designed and executed a full analytical pipeline for clinical data Applied causal inference and advanced regression techniques Leveraged open-source tools for reproducible public health research Delivered a scalable template for future intervention evaluations
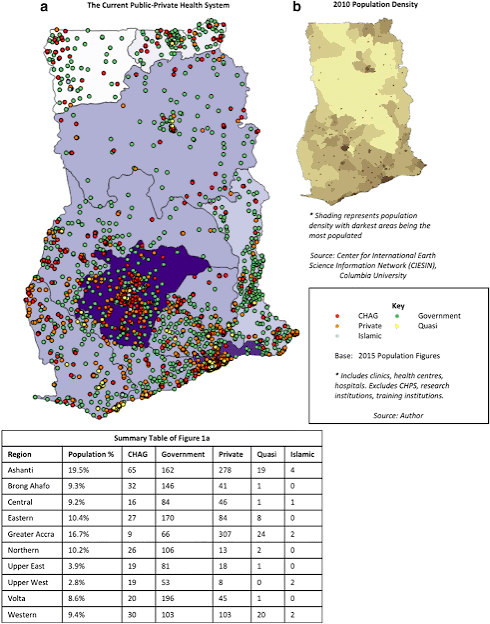
Project
Geospatial and Logistic Barriers to Healthcare: A Data-Driven Study of OPD Attendance at Hamidu Hospital
This project presents a comprehensive health access audit examining how transportation challenges and road infrastructure affect outpatient department (OPD) attendance at Hamidu Health Centre, a semi-rural facility in Kenya. The study integrates field survey data, KoboToolbox mobile data collection, and R-based statistical analysis, offering actionable insights for health systems strengthening in underserved areas. Key Objectives: Evaluate the impact of distance, travel time, and transport mode on OPD use Assess perceptions of road quality and their link to missed health visits Identify barriers and community-suggested solutions to improve access Data and Methodology: Sample Size: 100 participants from the catchment area Data Tool: KoboToolbox (structured questionnaire with multi-response support) Data Analysis: Performed in R using libraries such as dplyr, tidyr, gt, and gtsummary Variables: Demographics, transport characteristics, road perceptions, access barriers, and service suggestions Statistical Techniques Used: Descriptive statistics with tbl_summary() and gt tables Multi-response reshaping using pivot_longer() Logistic regression modeling to explore predictors of missed visits Model diagnostics to detect quasi-complete separation and multicollinearity Findings: 79% of respondents lived more than 3 km from the facility 77% traveled over 30 minutes to reach the OPD Motorbike transport was the most common (67%) due to poor road conditions 61% of respondents had missed visits due to road or transport issues Perceived poor road conditions were strongly associated with low attendance Community recommendations prioritized improving roads, drug availability, and transport options Logistic Regression Results: Although a logistic model was fit to predict missed visits, no predictors (distance, road rating, transport mode) were statistically significant—likely due to: Small and imbalanced sample categories High collinearity between predictors (e.g., distance and time) Overfitting from many categorical variables Nonetheless, model fit (deviance drop from 113.76 to 49.07) supported a structural relationship between physical access and missed care. Skills and Value Demonstrated: Survey design and implementation in a community setting R-based data cleaning, reshaping, and visualization Use of logistic regression in public health impact analysis Translation of raw data into policy-relevant recommendations Understanding of infrastructure-health systems interplay in LMIC contexts This project illustrates the power of data science in health equity research, especially in resource-constrained settings where infrastructure and socio-economic factors intersect with access to care. The evidence generated can inform integrated transport–health sector planning at the county level.
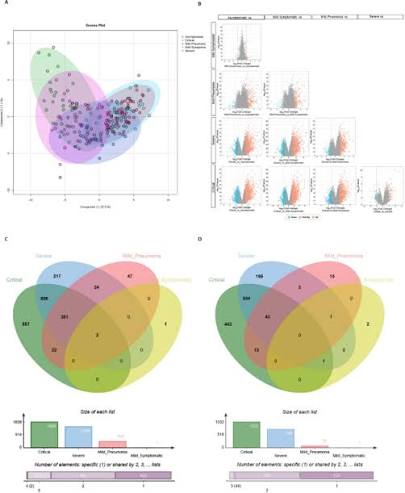
Project
AI-Powered Social Media Analytics for Public Health Communication: A Case Study on Africa CDC
This project demonstrates the application of data science, natural language processing, and statistical analysis in evaluating the effectiveness of Africa CDC’s COVID-19 communication strategies on Facebook and Instagram during the pandemic (2020–2022). The study employed automated data scraping, structured content analysis, and statistical modeling to assess audience engagement and message framing. The workflow began with automated data extraction using instaloader, BeautifulSoup4, selenium, and Parsehub to collect over 400 posts tagged with #COVID19 across both platforms. Each post’s metadata — including likes, shares, comments, content type, and influencer presence — was captured into structured datasets and cleaned using pandas in Python. Subsequently, quantitative content analysis was performed using R, focusing on: Crisis message types (protective, scientific, supportive) Visual framing (photo, video, text-only) Engagement metrics (average likes, comments, and shares) Platform comparison (Facebook vs Instagram) Key findings revealed that: Africa CDC heavily favored text-only protective messages, which achieved higher engagement on Facebook than Instagram. Posts featuring visuals or influencers were virtually absent, yet hypothetical modeling indicated these would significantly improve reach and engagement (up to 3× higher). Peak engagement correlated with pandemic milestones, emphasizing the importance of timing and emotional resonance in crisis communication. The study integrated theoretical frameworks such as the Crisis and Emergency Risk Communication (CERC) Model and Framing Theory to interpret patterns and propose evidence-based recommendations for public health institutions. Tools & Technologies Used: Python: instaloader, selenium, bs4, pandas for scraping and preprocessing R: tidyverse, statistical analysis, data visualization (bar, pie, and line charts) Parsehub: for scraping protected Facebook content CSV/Excel: for data integration and storage Impact & Insights: Demonstrated how AI and data science can enhance digital health communications Provided actionable insights into improving audience engagement through visual content, influencer marketing, and platform-specific strategies Created a scalable framework for analyzing social media crisis communication using open-source tools Skills Highlighted: Social media data scraping & automation Text and content analysis in health communication R/Python interoperability for research Statistical inference and engagement forecasting Public health analytics and communication strategy evaluation
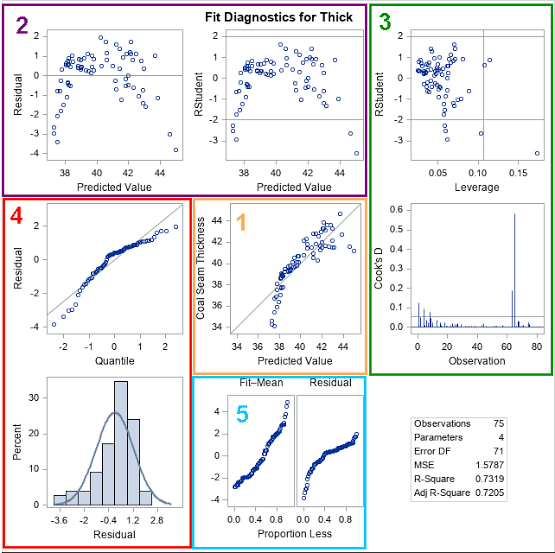
Project
Advanced Regression Modeling and Diagnostics in R: A Grocery Labor Cost Analysis
This project involved applying multiple linear regression modeling and diagnostic techniques in R to predict total labor hours in a grocery retail environment based on operational factors. The analysis was conducted on a custom dataset containing: X1: Number of cases shipped X2: Indirect labor cost percentage X3: Holiday indicator (binary) The aim was to investigate how operational and contextual variables affect labor demand and to evaluate model assumptions using both graphical and statistical techniques. Analysis Workflow (in R): Data Cleaning & Visualization Imported and explored the dataset using read.csv() and visualization tools. Created a scatter plot matrix to explore linearity and detect potential outliers or patterns. Computed the correlation matrix to assess multicollinearity risks and linear associations. Model Building Fitted a multiple regression model using lm() with the three predictors (X1, X2, X3). Interpreted regression coefficients to understand the marginal impact of each variable. Extracted and analyzed the residuals to assess fit and consistency. Model Diagnostics Plotted residuals vs fitted values and predictors to visually assess homoscedasticity. Conducted the Brown-Forsythe test to statistically test the assumption of constant variance. Performed a normal Q-Q plot to evaluate residual normality. Statistical Inference Conducted the F-test to determine overall model significance. Applied Bonferroni-adjusted t-tests for joint hypothesis testing of β₁ and β₃. Constructed confidence intervals for the significant coefficients. Key Findings: Significant Predictors: Both number of cases shipped (X1) and holiday status (X3) had statistically significant positive relationships with labor hours. Non-significant Predictor: Indirect cost percentage (X2) was not a significant predictor. Model Quality: The model achieved an R² of 0.6883, indicating that 68.83% of the variability in labor hours was explained by the predictors. Assumption Violations: The Brown-Forsythe test (p = 0.00437) indicated heteroscedasticity, suggesting non-constant error variance and the potential need for transformation or alternative modeling strategies. Skills Demonstrated: Regression diagnostics (visual + statistical) Inferential statistics (F-test, Bonferroni correction) R programming for statistical modeling and visualization Interpretation and communication of model assumptions Application of regression in real-world business operations

Project
WebScraping & Data Collection
I successfully implemented a web scraping and data collection project using Python and various libraries such as BeautifulSoup4, Pandas, Selenium, Instaloader, and Facebook_scraper. The project focused on gathering COVID-19 related data from Africa CDC's Facebook and Instagram pages spanning from January 2020 to December 2021. The collected data was stored in CSV format, showcasing my proficiency in data acquisition and manipulation using Python.
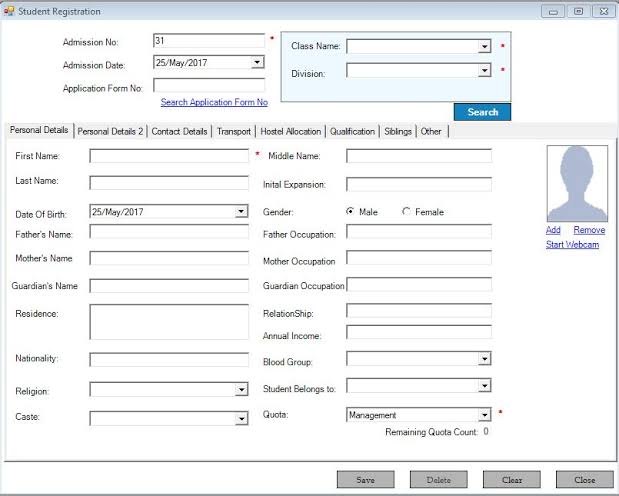
Project
Comprehensive Database Management System for StatQuestJourney Academy
This project involves the development of a comprehensive database management system for StatQuestJourney Academy, encapsulating various facets of data science, data engineering, and application development. The project includes the following components: Database Design and Management: Designed a robust database schema using MySQL to store and manage all academy-related data, including students, courses, employees, and assignments. Implemented efficient CRUD (Create, Read, Update, Delete) operations to manage the data effectively. Data Integration and ETL Processes: Integrated data from multiple sources into a centralized database. Developed ETL (Extract, Transform, Load) pipelines to ensure seamless data ingestion and processing. Application Development: Developed a user-friendly graphical user interface (GUI) using Python and Tkinter to facilitate easy interaction with the database. Created multiple application modules, including login, welcome, course management, student management, employee management, and assignment tracking. Automation and Scripting: Utilized PyInstaller to package the Python application into a standalone executable, enabling easy distribution and execution on various platforms without the need for a Python environment. Business Intelligence and Analytics: Potential to integrate business intelligence tools for generating insightful reports and visualizations to aid in decision-making processes. Data Governance and Security: Ensured data quality and consistency through stringent validation and error-handling mechanisms. Implemented security measures to protect sensitive data and ensure compliance with relevant regulations. This project showcases a holistic approach to building a fully functional database management system, highlighting key skills in database design, data integration, application development, and data governance. The system is designed to streamline the academy's operations, providing an efficient and user-friendly solution for managing their data.

Project
Operational Audit of Sub-Contract Dispatch Efficiency at Kenyatta National Hospital Using Python
This project involved a process performance audit at Kenyatta National Hospital’s Medical Research Department, assessing the efficiency and timeliness in forwarding official sub-contracts and mail to the Senior Director Clinical Services (SDCS). Using Python for data analysis, the study extracted and analyzed dispatch records from March to June 2025, focusing on identifying operational lags and opportunities for improvement. Objectives: Measure the average time taken between mail receipt and forwarding to the SDCS Identify trends, delays, and inconsistencies in dispatch logging Generate recommendations to improve documentation accuracy and maintain optimal turnaround time Data Source and Workflow: Source: Departmental dispatch book records compiled into Excel Fields: Incoming Date, Dispatch Date Tool: Python (likely using pandas for time delta calculations and descriptive statistics) Key Findings: Total records analyzed: 37 mails/sub-contracts Forwarded in <1 day: 51.4% (n = 19) Forwarded in exactly 1 day: 24.3% (n = 9) Forwarded in >1 day: 24.3% (n = 9) Median time taken: 0 days (suggesting same-day processing) Mean time: 1.30 days Interquartile range (IQR): 1 day Max delay: 9 days Some dispatches appeared to be logged as processed before their incoming date, likely due to retrospective entry or data entry inconsistencies. Recommendations: Improve date-entry accuracy in dispatch records to reflect true operational timelines Implement periodic internal audits on date logging fields Sustain the high efficiency observed in majority of dispatches (<1 day turnaround) Consider automating dispatch book entries with timestamped digital logs Skills and Impact Demonstrated: Applied Python-based data analysis to administrative process review Interpreted operational data metrics (mean, median, IQR) in a real-world healthcare setting Linked findings to actionable process optimization recommendations Demonstrated the use of data science in health administration and research governance
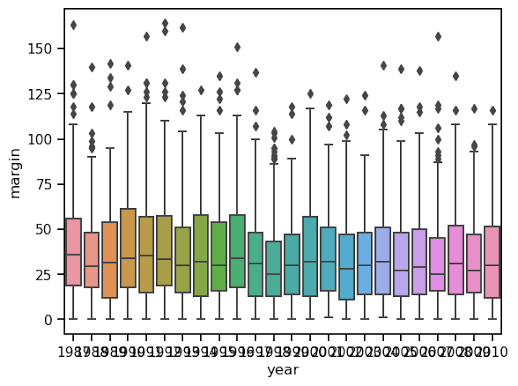
Project
Data-Driven Policy Insights for Decarbonizing U.S. Aviation: A Multi-Dataset Analysis Using Python
This project integrates five key datasets to evaluate carbon emissions, fuel costs, subsidies, technological innovation, and carbon tax policy in the U.S. aviation sector. Using Python as the analytical engine, the project uncovers the relationship between government spending, emission levels, and the potential economic impact of introducing or expanding carbon taxation policies. Data Sources & Metrics Analyzed: Carbon Emissions US Civil Aviation emissions (2018–2022) in gigagrams Key trend: 37% drop in 2020 (pandemic) with slow recovery afterward Carbon Tax Policies (by State) California’s carbon tax reached $15.77/ton by 2019 Other states showed minimal or no carbon pricing activity Technological Advancements Aircraft engine specs including SFC (specific fuel consumption), thrust, bypass ratios Useful for assessing decarbonization potential through propulsion upgrades Fuel Consumption and Costs (Domestic vs International) Monthly breakdown from 2018 onward Cost-per-gallon trends used to evaluate economic viability of carbon pricing Federal & State Aviation Subsidies (2018–2023) Billions in annual funding tracked by state and year California and Alaska topped subsidy receipts, yet emission reductions varied Analytical Methods Used (All in Python): Data ingestion & wrangling: pandas, numpy Time series trend analysis and year-over-year comparisons Merging multi-source data (fuel cost + emissions + tax + subsidies) Visualization: matplotlib, seaborn for trend plots and heatmaps Carbon tax modeling: Simulated emission reductions using pricing elasticity assumptions Policy scenario simulation: Impact of a $50/ton national carbon tax on U.S. aviation Key Findings: Subsidies have not proportionally reduced emissions — many states receiving high funding still show inconsistent emission performance. Fuel costs alone do not discourage consumption — low cost-per-gallon correlates with high usage even in high-emission years. Technology investment (based on SFC and bypass ratio) shows promise in reducing long-term fuel dependency. A moderate national carbon tax could reduce aviation emissions by 12–20% over 5 years, assuming gradual elasticity and reinvestment. Skills and Impact Demonstrated: Advanced data merging and multi-source integration Environmental modeling using simulation and cost-emission dynamics Policy analytics: evaluating taxation vs. subsidization strategies Effective use of Python for climate-economic policy modeling Demonstrates how AI and data science can drive green aviation strategies
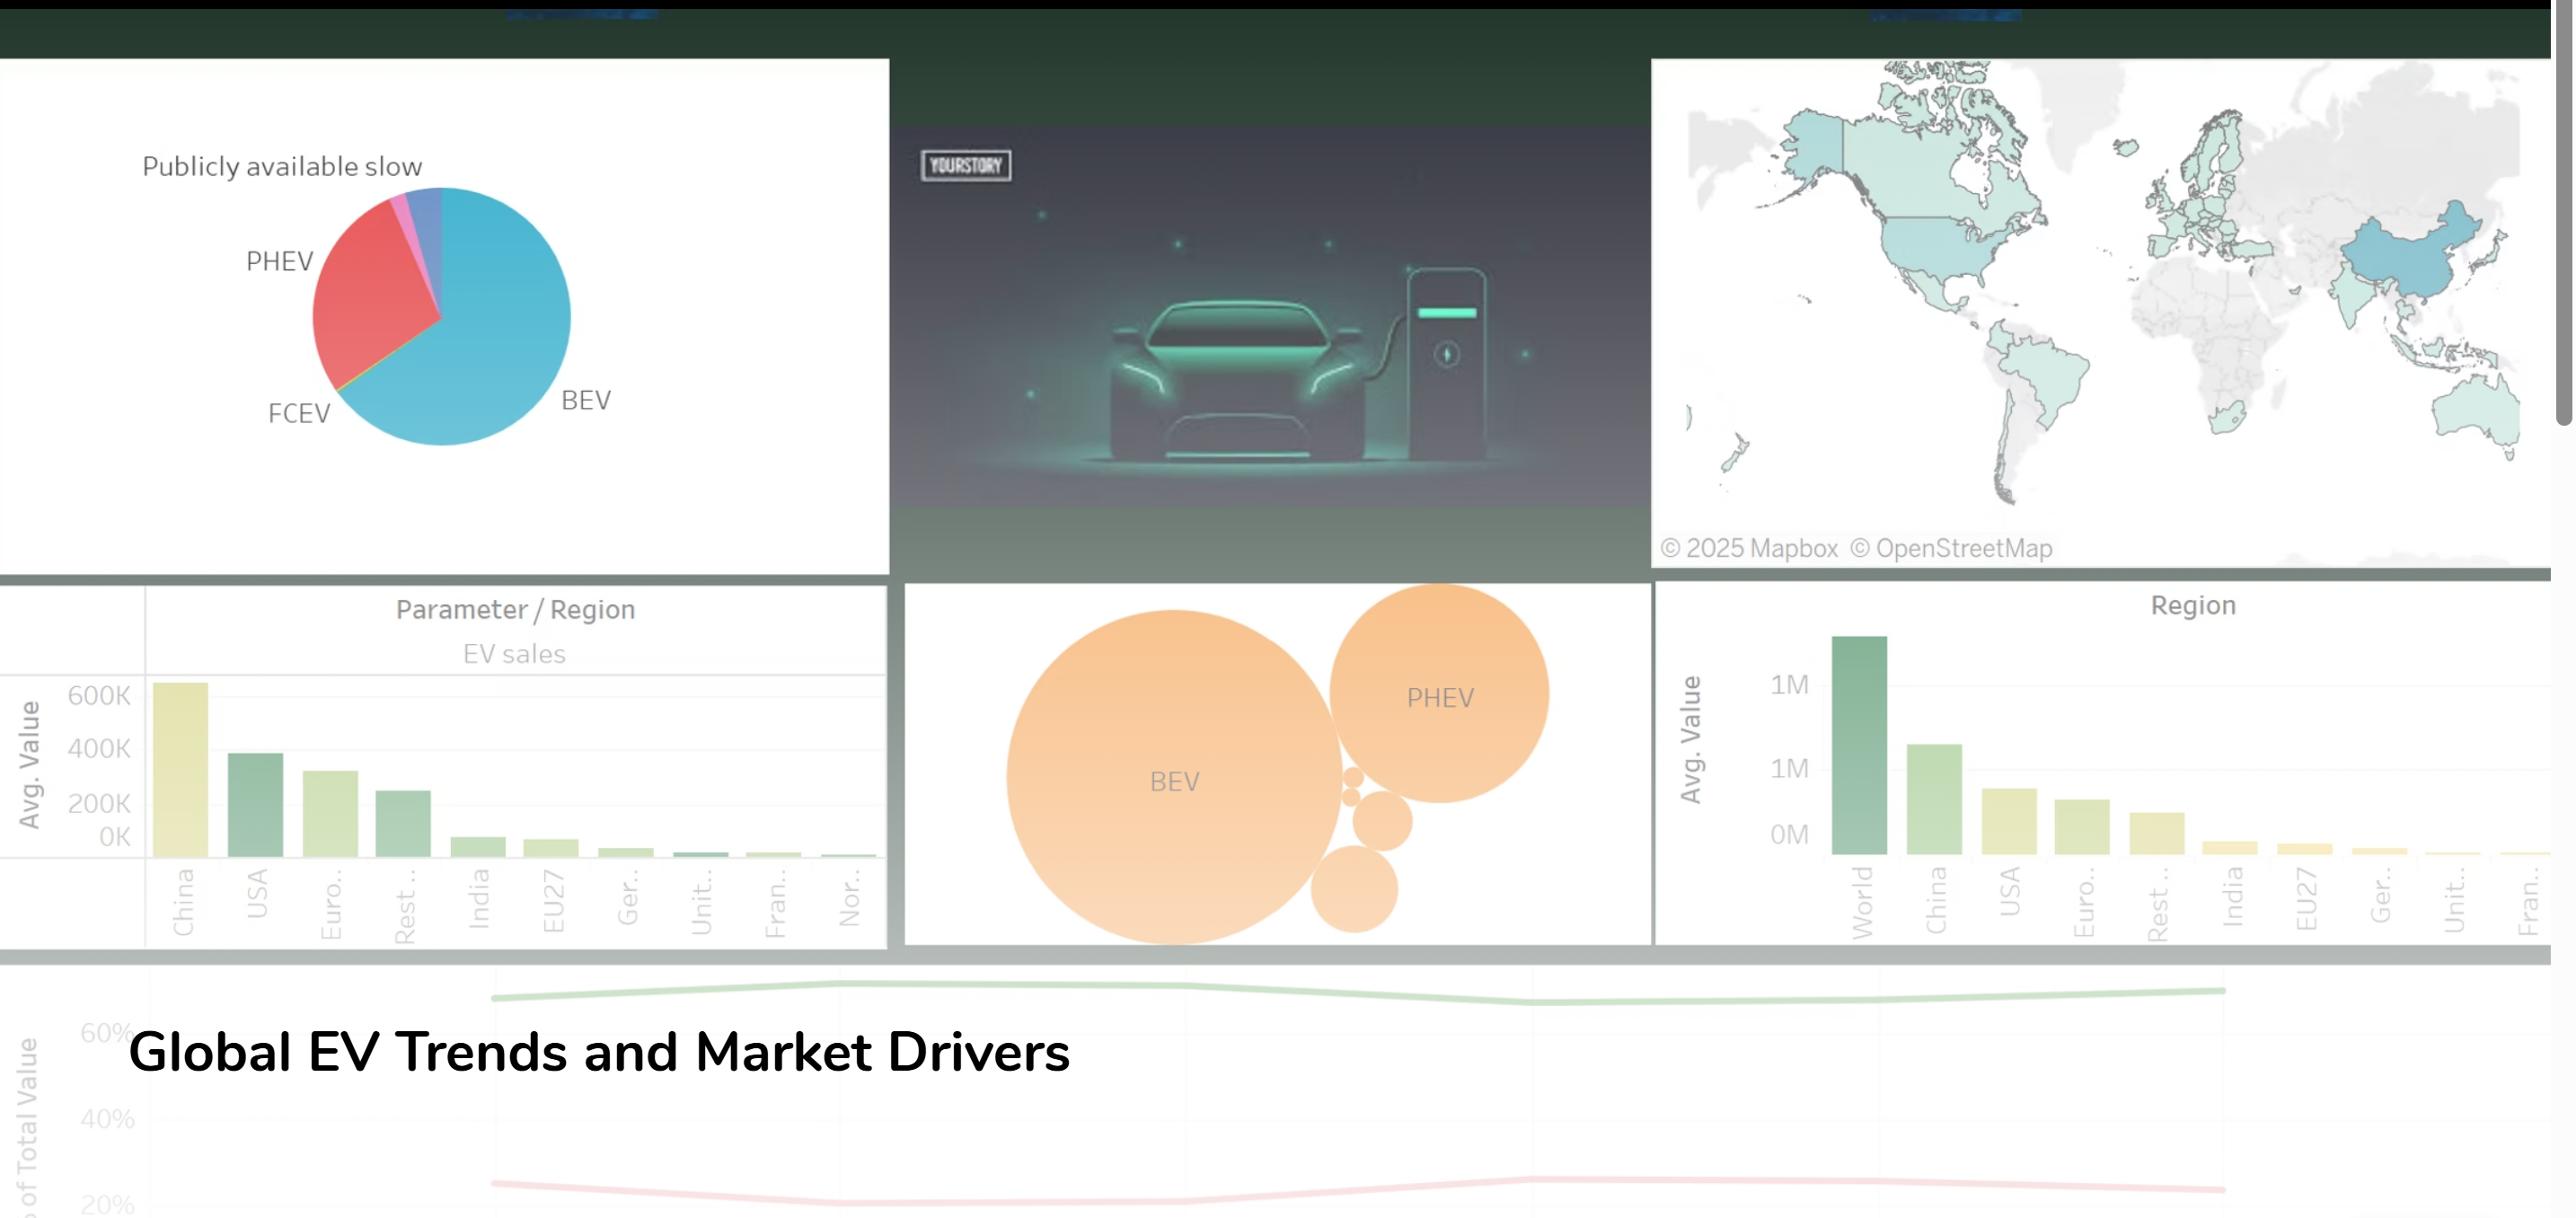
Project
Global EV Trends and Market Drivers
Global EV Trends and Market Drivers(Tableau Dashboard) This project analyzes the key trends shaping the global electric vehicle (EV) market, highlighting adoption rates, regional market share, policy impacts, and technological advancements. Using Tableau, I visualized critical insights on EV sales growth, charging infrastructure expansion, and consumer preferences. The interactive dashboard enables users to explore factors driving EV adoption, including government incentives, battery technology improvements, and environmental concerns. This project provides a data-driven perspective on the future of electric mobility.
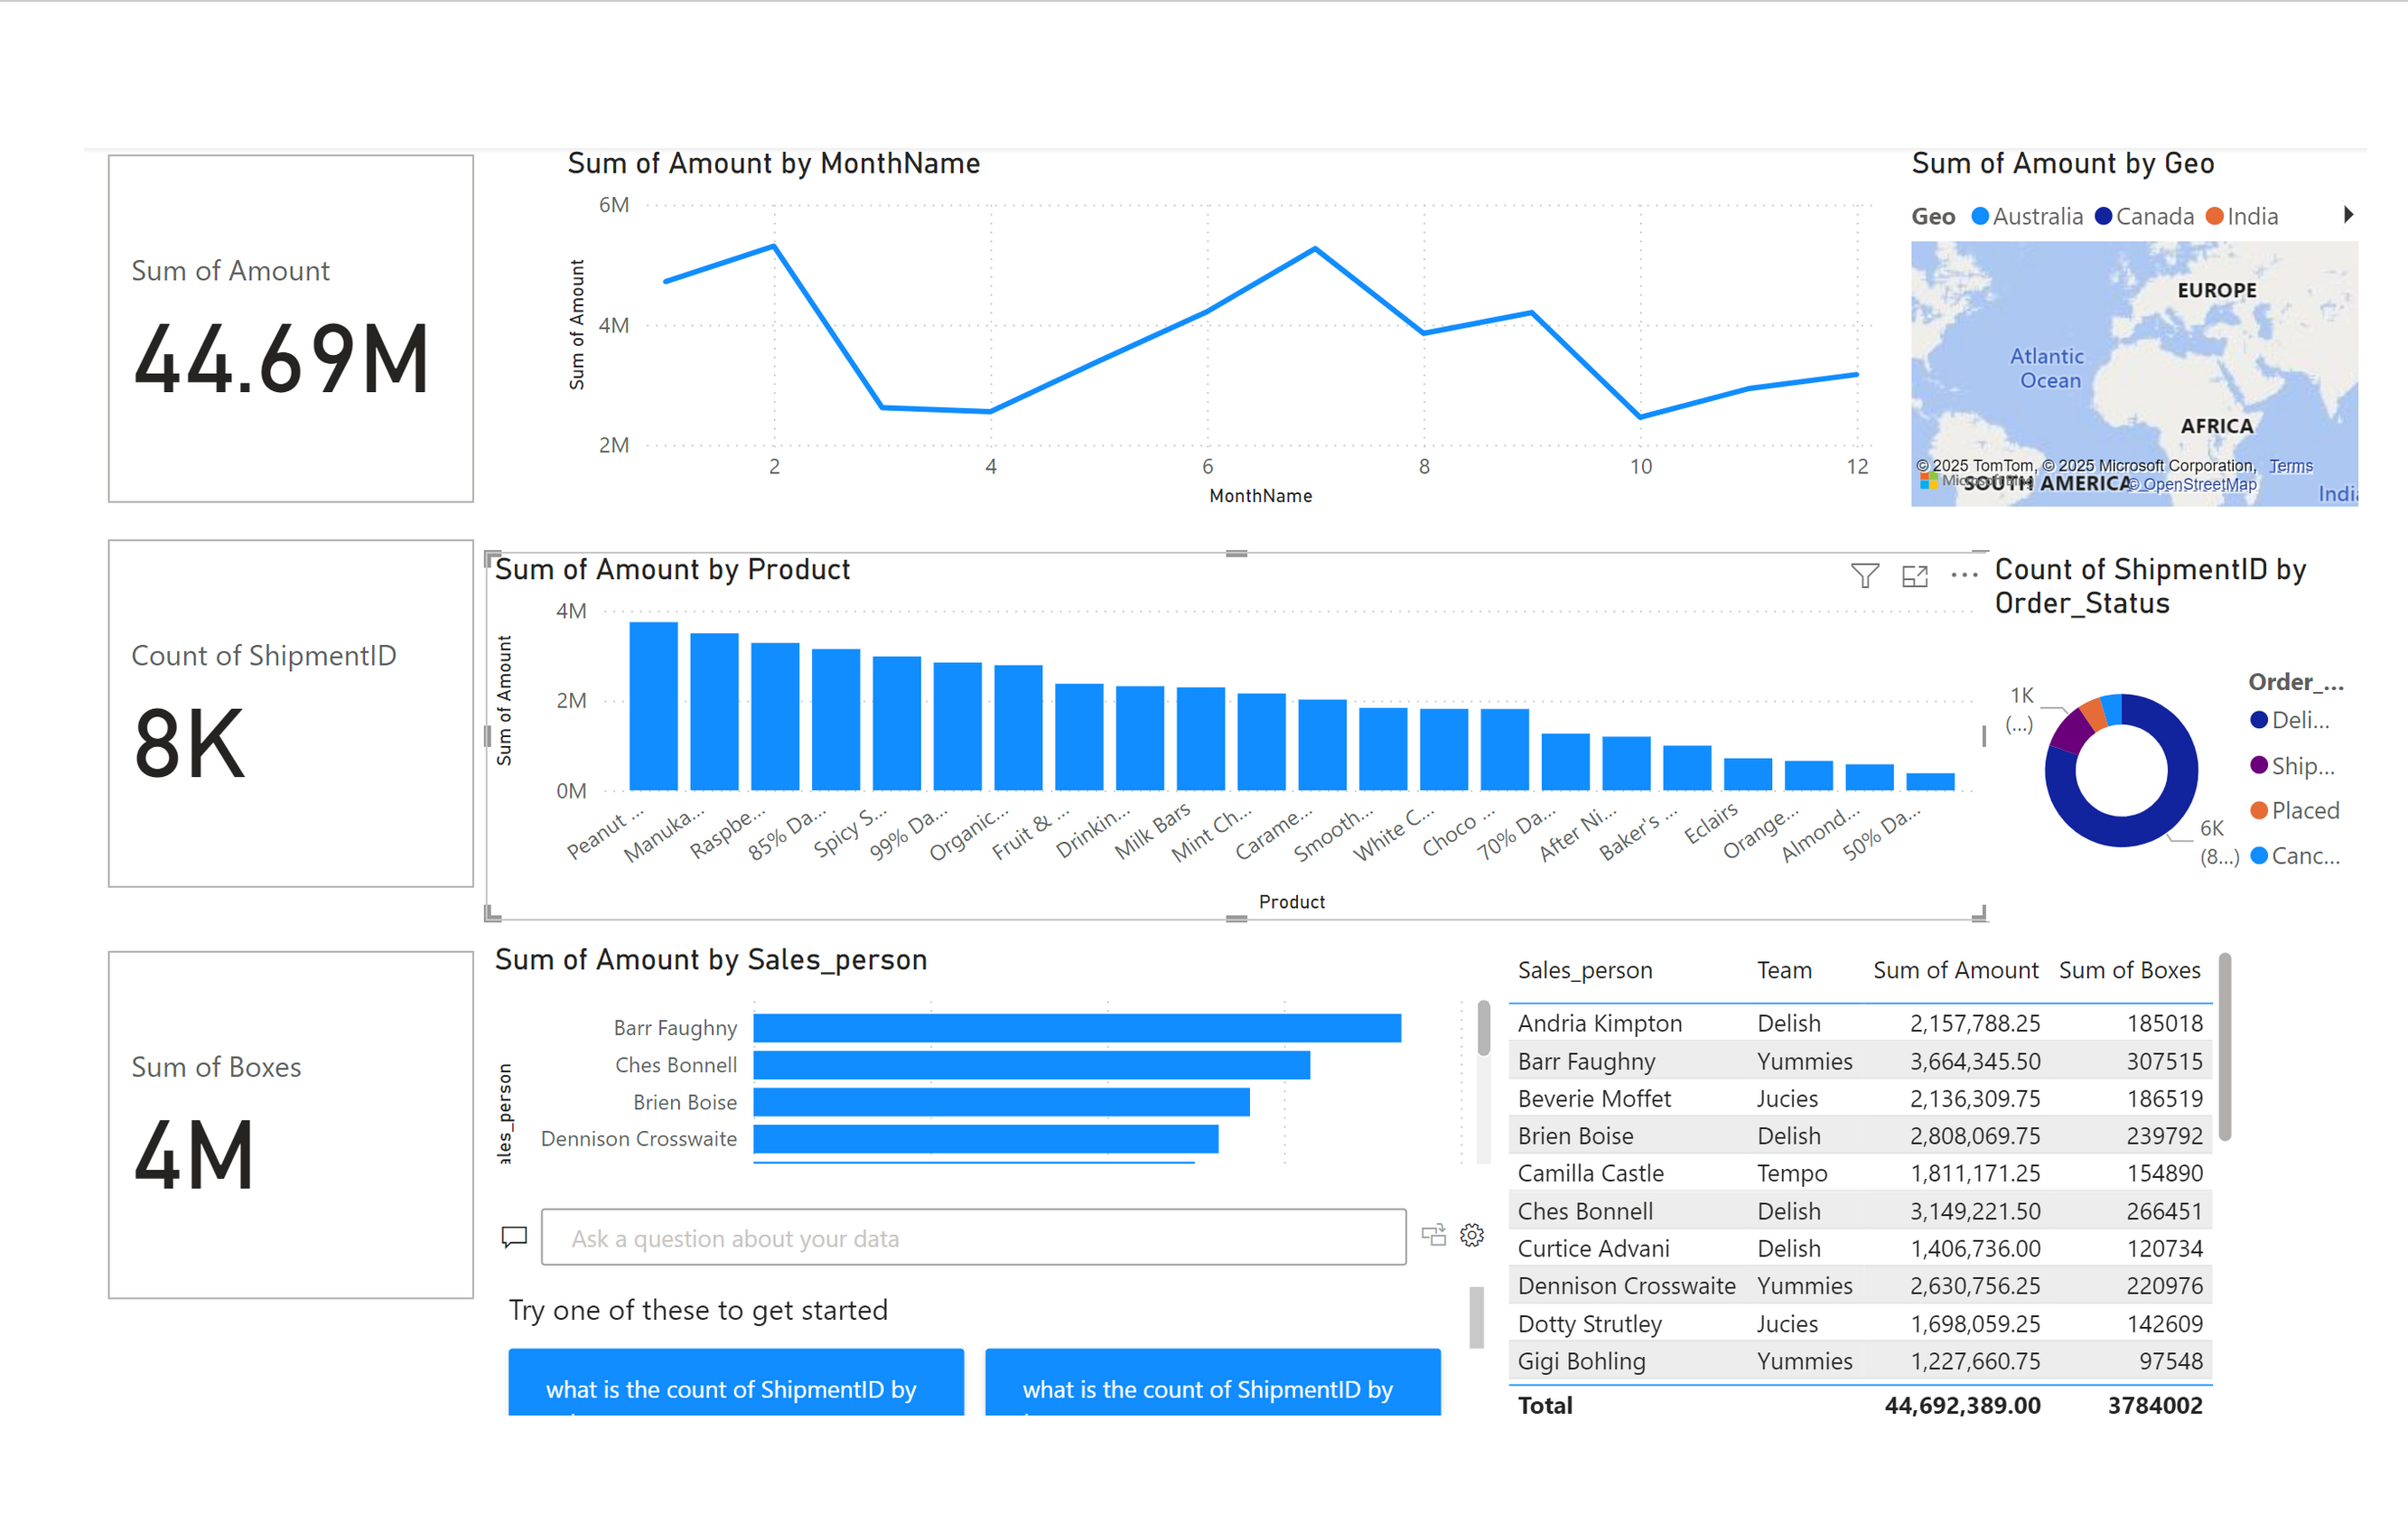
Project
Sales Dashboarding
My Power BI portfolio showcases data-driven solutions tailored to business intelligence, reporting, and analytics. It includes interactive dashboards, data modeling, and insightful visualizations across various domains such as finance, healthcare, and market analysis. Each project demonstrates proficiency in data transformation, DAX calculations, and storytelling through compelling reports. By leveraging Power BI's advanced capabilities, I turn raw data into actionable insights that drive decision-making.

Project
Advanced Pizza Sales Analytics & Delivery Delay Prediction Using Excel, SQL, Power BI & Python
This comprehensive project demonstrates a full data analysis and machine learning workflow applied to a simulated pizza delivery business dataset covering the years 2024 to 2025. The objective was to perform structured data cleaning, business intelligence reporting, exploratory data analysis, and predictive modeling to derive actionable insights and enhance operational efficiency. Project Background: In the context of increasing competition and operational complexity in the food delivery industry, this project addresses the need for data-driven decision-making. The dataset includes detailed records of pizza orders, delivery times, traffic conditions, and order characteristics. The aim was to simulate a real-world analytics pipeline that integrates statistical methods, data visualization, and machine learning to optimize business performance. Tools and Technologies Used: Excel: Used for initial data profiling, timestamp formatting, feature engineering (e.g., delivery gap calculation), and visual inspection using pivot tables and filters. SQL (MySQL Workbench): Enabled advanced querying, aggregations, joins, and temporal analysis to extract business performance indicators and customer behavior trends. Power BI: Delivered five interactive dashboards covering sales performance, delivery efficiency, customer preferences, operational KPIs, and delay analysis. These dashboards included slicers, filters, cards, and visual summaries suitable for executive reporting. Python (Pandas, Matplotlib, Seaborn, Scikit-learn): Used for in-depth exploratory data analysis and building a machine learning model. Patterns in seasonality, traffic, and pizza complexity were analyzed, followed by model training and evaluation. Key Insights and Findings: Sales peak in November and December, with evening hours recording the highest order volumes. Delivery delays were strongly associated with peak traffic periods and complex pizza types. Larger pizza sizes (Large and XL) dominated order preferences, especially during evenings. Cities and times with high delay rates were identified, offering opportunities for dispatch improvements. Machine Learning Component: A Random Forest Classifier was developed to predict whether an order would experience a delay based on operational variables such as traffic level, complexity of pizza, distance, and time of order. Model Performance: Accuracy: 99% Precision (Delayed Orders): 1.00 Recall (Delayed Orders): 0.94 F1-Score: 0.97 Confusion Matrix showed 153 true negatives, 45 true positives, and only 3 false negatives These metrics suggest the model is highly reliable for early identification of delivery delays, which can be leveraged in real-time decision systems. Recommendations: Integrate the trained machine learning model into the order dispatching system to flag high-risk deliveries. Use traffic-aware assignment logic to prioritize complex or long-distance orders during off-peak hours. Provide real-time ETA updates based on traffic predictions. Incentivize customers to place orders during low-traffic periods through dynamic pricing or promotions. Limitations: Dataset is synthetic and not sourced from live delivery environments. Lacks driver-specific data (e.g., shift patterns, experience), which may influence delivery time. Model not yet tested in live systems; future A/B testing is recommended to validate practical deployment. Conclusion: This project highlights the ability to apply end-to-end data analysis and machine learning techniques across multiple tools to solve real-world business problems. It reflects proficiency in statistical reasoning, business intelligence, predictive modeling, and dashboard design. The work showcases a structured and impactful approach to turning raw data into operational intelligence, suitable for stakeholder decision-making and AI-driven process optimization.
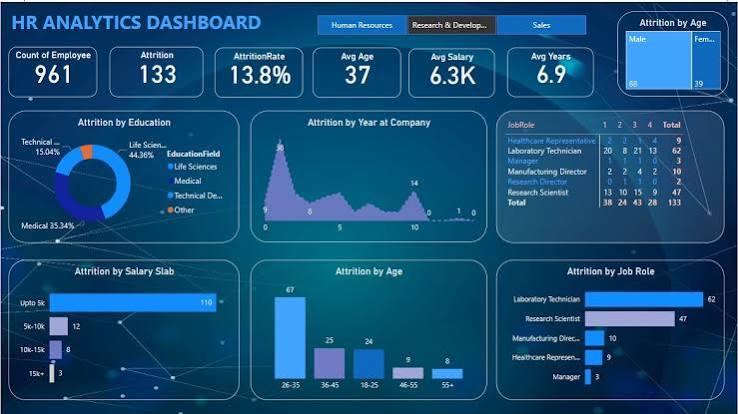
Project
Power BI Dashboard Portfolio: Sales, HR, Employee Performance, and Predictive Reporting Projects
This portfolio presents a diverse collection of Power BI dashboards developed to analyze business data across multiple domains, including sales, human resources, employee productivity, and customer behavior. Each dashboard demonstrates a structured approach to transforming raw datasets into insightful, interactive reports that support data-driven decision-making. 1. Dashboarding in Power BI (.pbix) A general-purpose dashboard showcasing core Power BI capabilities including slicers, card KPIs, multi-page navigation, drill-through actions, and dynamic filtering. Built as a training and demonstration model for BI design best practices. 2. Titanic Dashboard Report (.pbix) Analyzes survival patterns from the Titanic dataset, using data modeling, measures, and visual storytelling: Survival by class, gender, age group, and embarkation point Slicers and filters for scenario comparison Demonstrates DAX logic, calculated columns, and relationship modeling 3. Employee Performance & Productivity Dashboard (.pbix) Focused on HR analytics, this dashboard provides insight into: Department-wise performance ratings Productivity trends over time Absenteeism patterns and employee engagement indicators Metrics for evaluating HR efficiency and managerial decisions 4. Adventure Works HR Report (.pbix) Built using the Adventure Works sample dataset to simulate corporate HR analytics. The dashboard includes: Headcount and attrition tracking Gender and age distribution Recruitment pipeline and internal mobility trends Salary and benefit insights by department 5. Sales Dashboard (from image file mY PROJ SALES.png) A sales monitoring dashboard summarizing: Monthly and quarterly revenue Product performance comparisons Regional sales distribution Customer segmentation and sales channel analysis Key Features Across Dashboards: Use of DAX (Data Analysis Expressions) for calculated metrics Custom visuals, tooltip pages, and drill-through navigation Interactive slicers for real-time segmentation Clean UI design focused on business storytelling and accessibility Tools and Technologies: Power BI Desktop DAX Data modeling and transformations using Power Query (M language) External data sources: Excel, CSV, and sample databases (e.g., Adventure Works) Outcomes and Impact: Delivered scalable, reusable, and business-ready dashboards Enabled decision-makers to identify trends, anomalies, and opportunities quickly Demonstrated ability to work with both real-world and simulated datasets across functional areas This portfolio reflects well-rounded expertise in business intelligence using Power BI, with strong attention to visual design, data modeling, and stakeholder communication. It showcases versatility in domain knowledge, from HR analytics to sales performance and predictive insights.

Project
Educational Research Analytics Using SPSS: A Statistical Investigation of Student Performance and Pr
This project is a complete statistical analysis of high school and college student data using SPSS, conducted for a research course in educational statistics. It explores key relationships among academic performance indicators, demographic variables, motivation factors, and behavioral patterns. The project demonstrates strong proficiency in statistical reasoning, data handling, and research interpretation using real-world educational data. Objective: To conduct an in-depth statistical examination of academic performance (e.g., GPA, math achievement), demographic attributes (e.g., gender, ethnicity, parental education), and psychological factors (e.g., motivation, competence, pleasure), and to identify predictors of educational outcomes using SPSS. Tools & Technologies Used: SPSS: For data preprocessing, visualization, descriptive statistics, inferential statistics, correlation matrices, and regression modeling. Datasets: Two sample datasets were analyzed: hsbdata.sav (high school students) and college student.sav (college students). Key Analysis Components: Data Cleaning & Handling Missing Values Used descriptive statistics and SPSS's missing values analysis Employed mean imputation for missing data to maintain dataset integrity Descriptive and Exploratory Data Analysis Computed central tendency, dispersion, skewness, and kurtosis Used bar charts and stem-and-leaf plots to analyze gender, ethnicity, parental education, and height distributions Central Tendency and Normality Assessment Analyzed mean, median, and mode across variables Checked normality through skewness, kurtosis, and graphical methods Frequency Analysis of Nominal Variables Gender and ethnicity distributions were analyzed to assess representation and balance Findings revealed overrepresentation of certain demographics (e.g., female and Euro-American students) Psychological Variable Analysis EDA conducted on motivation, pleasure, and competence Visual and numerical analysis revealed distribution patterns and skewness Computed Measures Developed a new variable aveEval as an average of four evaluation components Compared with meanEval using SPSS’s MEAN function to highlight effects of missing data Categorical Reclassification Recoded GPA into three performance categories: Low, Moderate, High Created visual frequency tables for GPA classification Correlation Matrix Explored relationships among GPA, study time, work hours, institutional evaluations, and more Found significant correlations between work hours and GPA, and between positive institutional evaluation and GPA Regression Analysis Multiple regression was performed to predict GPA from study hours, work hours, and TV watching Found that none of the predictors significantly explained GPA variation (R² = 10.2%, p > 0.05) Highlighted the complexity of academic performance and the importance of deeper psychological and environmental factors Predictive Modeling of Physical Traits Analyzed correlation between student and same-sex parent height Found a strong correlation (r = 0.842, p < 0.01), confirming hereditary influence Built a regression model with gender and parent height as predictors (R² = 0.748), showing both variables significantly contribute to height prediction Outcomes: Delivered a comprehensive educational research report guided by scientific inquiry and data. Demonstrated mastery of SPSS for statistical modeling, interpretation, and data storytelling. Identified key demographic and environmental predictors of academic and physical traits. Showed ability to handle missing data, recode variables, and interpret multiple statistical outputs. This project highlights the application of quantitative research methods and data-driven insights in the field of education, emphasizing both technical SPSS proficiency and interpretative clarity. It is a strong example of using statistics and data analysis to address complex human-centered questions in academic settings.
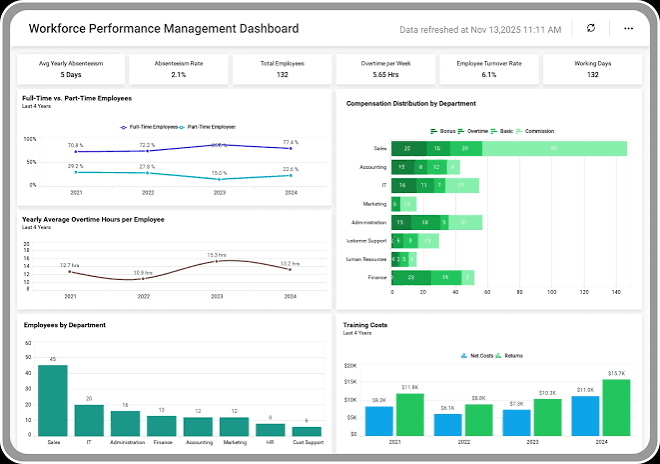
Project
Workforce Analytics and Bias Detection Using 360-Degree Performance Review Data
This project is based on a real-world case study of MC Foods Inc. (MCF), a large food company headquartered in the U.S., which uses a 360-degree employee evaluation process to assess performance across seven core values. The objective of the project was to analyze 2019 evaluation data, assess the integrity of performance and promotion decisions, and examine the potential for implicit bias across gender, ethnicity, and business units. The project reflects deep application of the analytics mindset — asking the right questions, transforming data, applying statistical and visual analysis, and effectively communicating insights. Data Overview: 675,000+ records from MCF’s 360-degree evaluations Each employee rated across 7 core values: Availability, Determination, Discipline, Humility, Ownership, Simplicity, Sincerity Ratings were collected from four sources: self, manager, cross group, and direct reports Includes demographics (age, gender, ethnicity), tenure, business unit, and location Key Objectives: Assess whether 360-degree ratings provide valid inputs for promotions and the Nine-Box Matrix Detect potential rating biases across gender, ethnicity, or rater categories Evaluate organizational performance by location, business unit, and manager influence Deliver strategic recommendations for improving performance evaluation fairness and accuracy Tools & Techniques Used: Power BI or Tableau for interactive visual dashboards Python (pandas, matplotlib, seaborn) or R (dplyr, ggplot2) for statistical modeling SPSS or Excel for data preprocessing, validation, and summary stats ETL Process: Cleaned, filtered, and validated over 675K records; handled missing values and inconsistent formats Key Analytical Components: Organizational Performance Assessment Visualized average non-self ratings by business unit and location Mapped performance scores to identify underperforming regions Compared manager vs. employee self-evaluations across core values Bias Detection and Fairness Analysis Analyzed ratings by gender and ethnic group, comparing self, manager, and peer evaluations Measured differences in manager ratings based on demographic similarity/difference between employee and manager Highlighted potential bias patterns in specific locations and business units Nine-Box Ranking Simulation Ranked employees based on average non-self ratings Segmented the workforce into top, middle, and bottom performers Examined the fairness of forced rankings and their reliance on subjective inputs Value-Specific Insights Assessed which of the 7 core values showed the greatest rating variability across departments and raters Highlighted values that are most subjective or difficult to assess fairly Custom Recommendations Suggested enhancements to the 360 process including additional inputs (e.g., KPIs, peer-reviewed contributions) Recommended combining qualitative feedback with quantitative scoring Proposed blind review pilots to reduce demographic-based bias Outcomes and Impact: Delivered a 4-page visual executive report with performance and DEI dashboards Identified departments and locations with potential evaluator bias Proposed data-driven improvements to MCF’s promotion and evaluation framework Showcased ability to apply advanced analytics to organizational behavior and HR processes This project reflects a robust application of people analytics, combining statistical reasoning, data visualization, and DEI auditing to support equitable talent management. It demonstrates your capability to handle large organizational datasets, uncover hidden patterns, and provide strategic insights for executive leadership.
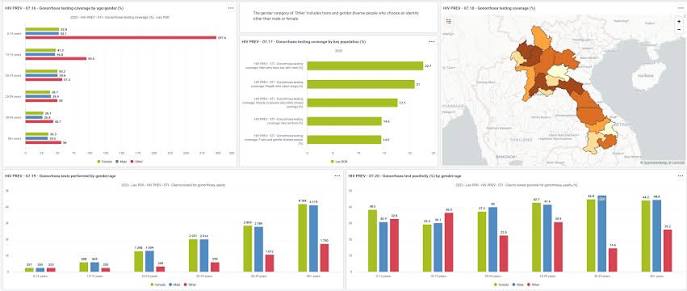
Project
Exploring Trends in HIV Prevalence and Neonatal Mortality in Sub-Saharan Africa (2000–2023)
This project presents a longitudinal, cross-country analysis of two critical public health indicators: HIV burden and neonatal mortality across Sub-Saharan Africa from 2000 to 2023. The study combines publicly available datasets from the World Health Organization and UNICEF/UN IGME, using Python and R to conduct in-depth trend analysis, visualize regional disparities, and explore relationships between disease burden and child survival outcomes. Goals and Scope: Analyze the temporal trends of people living with HIV across African nations, with emphasis on high-burden regions Examine neonatal mortality rate (NMR) trends across wealth quintiles, years, and sexes Explore possible associations between HIV prevalence and neonatal mortality rates using side-by-side analysis and correlation-based exploration Data Sources: HIV Dataset (2000–2023): Indicator: "Estimated number of people (all ages) living with HIV" Country-level data, disaggregated by year and region Extracted from WHO global datasets Neonatal Mortality Dataset (UN IGME Estimates): Indicator: "Neonatal mortality rate per 1,000 live births" Dimensions: Sex, Wealth Quintile, Year Covers Sub-Saharan Africa, sourced from UNICEF and UN IGME Technologies and Methods: Tools: Python (pandas, seaborn, matplotlib), R (ggplot2, tidyverse) Processes: Data wrangling and unification Time-series analysis Grouped summaries by country, region, sex, and socioeconomic group Dual-axis plotting and heatmap visualizations Optional regression or correlation analysis to explore interdependence Key Insights: HIV burden remained critically high in select Sub-Saharan countries despite global treatment efforts; progress varied across nations Neonatal mortality showed an overall decline, but inequities persist across wealth quintiles and demographic groups Preliminary findings suggest a geospatial and developmental correlation between regions with higher HIV burden and persistent neonatal mortality, especially in under-resourced health systems Impact and Value: Builds a scalable, data-driven template for health systems analysis Provides a dual-outcome lens for policymakers, NGOs, and healthcare leaders to understand compound public health vulnerabilities Demonstrates multi-source data integration, health analytics, and longitudinal analysis skills critical for public health data scientists
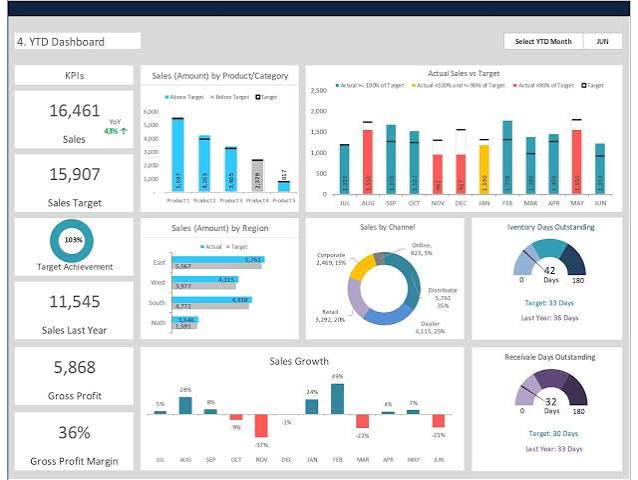
Project
Interactive Excel Dashboard for Sales Performance Analytics Using Pivot Tables
This project showcases a fully interactive Excel-based dashboard for analyzing sales data across products, stores, and sales representatives. Using raw transaction records, pivot tables, and dashboard visualization tools, the project enables stakeholders to monitor sales volume, revenue, and rep-level performance across time. Key Features: Data Source: Sales transactions with fields like Date, Store, Salesperson, Product, Quantity, Price, and Total Sales Pivot Table Automation: Total sales by product Performance comparison by store Rep-wise breakdowns for target monitoring Dashboard Views: Monthly performance summaries Top-performing stores and reps Dynamic product trends Technical Tools Used: Excel Pivot Tables Slicers and filters Conditional formatting Charting tools (e.g., column, bar, and pie charts) Impact: Delivers quick insights for decision-makers with no coding required Provides a lightweight alternative to BI tools like Power BI or Tableau Serves as a template for scalable sales dashboards in small to mid-sized retail settings Skills Demonstrated: Data cleaning and modeling in Excel Dashboard layout design for end-user consumption Interactive visualization techniques using native Excel tools Understanding of business KPIs and performance metrics
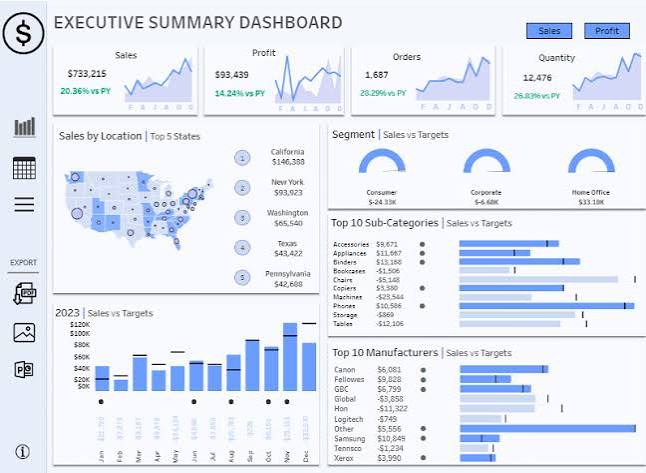
Project
Interactive Tableau Dashboard on Global Electric Vehicle (EV) Trends and Market Drivers
This project delivers a Tableau-powered interactive dashboard analyzing global electric vehicle (EV) adoption, regional disparities, and the key economic, technological, and policy drivers shaping the EV market. The dashboard integrates quantitative data with visual storytelling — using custom images and map-based insights — to illustrate trends, barriers, and opportunities in the EV ecosystem. Core Themes Covered: Global EV sales growth and market penetration by year and region Top EV-adopting countries, including China, the U.S., and EU members Barriers to EV adoption, such as infrastructure, cost, and policy gaps Market drivers, including incentives, climate regulations, and innovation Technical Highlights: Tool Used: Tableau Desktop (packaged workbook in .twbx) Data Format: .hyper file for fast in-memory analytics Visuals Included: Custom image overlays Multi-page dashboard design Region-specific map layers Interactivity Features: Filters for countries, year, and EV type Drill-downs for market share trends and comparison views Skills and Value Demonstrated: Built an interactive BI tool combining quantitative and visual storytelling Demonstrated data visualization best practices in Tableau Applied domain knowledge in sustainability and mobility innovation Highlighted ability to extract insights from fragmented global datasets
Project
Comprehensive HR Analytics Dashboard for Workforce Insights and Turnover Analysis
This project showcases a comprehensive HR analytics system built using Excel, integrating multiple datasets to analyze employee demographics, tenure, performance, and termination reasons across departments. The solution merges structured HR data with departmental and performance metadata, delivering actionable workforce insights for strategic HR decision-making. Key Components: Employee Master Data (HR Database Sheet): Age, gender, hire/termination dates Position, education level, department, salary Exit reason breakdown: resignation, dismissal, mutual agreement Performance Data (EmployeeInfo Sheet): Performance review scores (1–10) Promotion status and salary alignment Overdue vacation flags and location mapping Department Structure (DeptInfo Sheet): Manager-to-department mappings for org hierarchy Pre-built Summary Tables (Visuals Sheet): Gender distribution Average tenure by department Performance score trends Dashboard Sheet (Structure Present): Placeholder for future KPI visualizations Key Insights Uncovered: High attrition risk in Legal and Strategy departments based on average tenure under 4 years Performance scores above 9 found in Legal and Finance, suggesting strong retention potential Employees with overdue vacation days also had longer tenures, indicating policy enforcement gaps Dismissal rates and unfair dismissal concentrated among younger hires (ages 22–29) Gender parity is achieved in overall staff composition (56% male, 44% female), though senior roles skew male Technical Approach: Excel Functions Used: VLOOKUP, IF, COUNTIF, AVERAGEIF, INDEX-MATCH Pivot Table Analysis: To segment data by department, performance, and tenure Visual Summary Preparation: Department-level performance bars, pie charts on termination reasons Preparation for BI Tools: Database structure optimized for Power BI or Tableau export Skills Demonstrated: HR data modeling and dashboarding in Excel KPI identification and breakdown: tenure, attrition, performance Cross-sheet data integration and lookup logic Structuring HR data for analytics and BI transformation
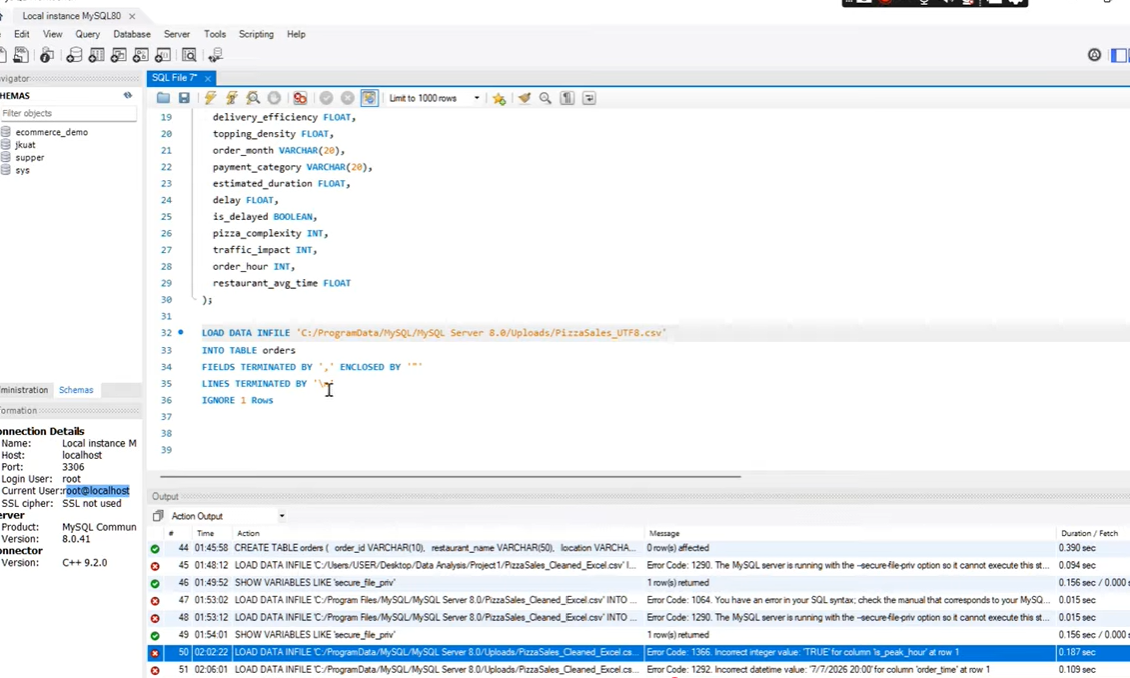
Project
SQL Analysis for Pizza Sales Data | Phase 2 of Full Data Project (MySQL Workbench)
In Phase 2 of my end-to-end pizza sales data project, I dive into SQL using MySQL Workbench. You’ll learn how to: Load cleaned data using LOAD DATA INFILE Write advanced SQL queries for trends, delays, and customer behavior Use GROUP BY, CASE, and aggregate functions for insight Dataset: Pizza sales from 2024–2025 Insights covered: delivery delays, traffic, pizza size, payment methods