
Project
Epidemiological Equity Analysis and Longitudinal Intervention Trajectories of Taenia solium Control Programs using Custom Equiplot Visualizations in R
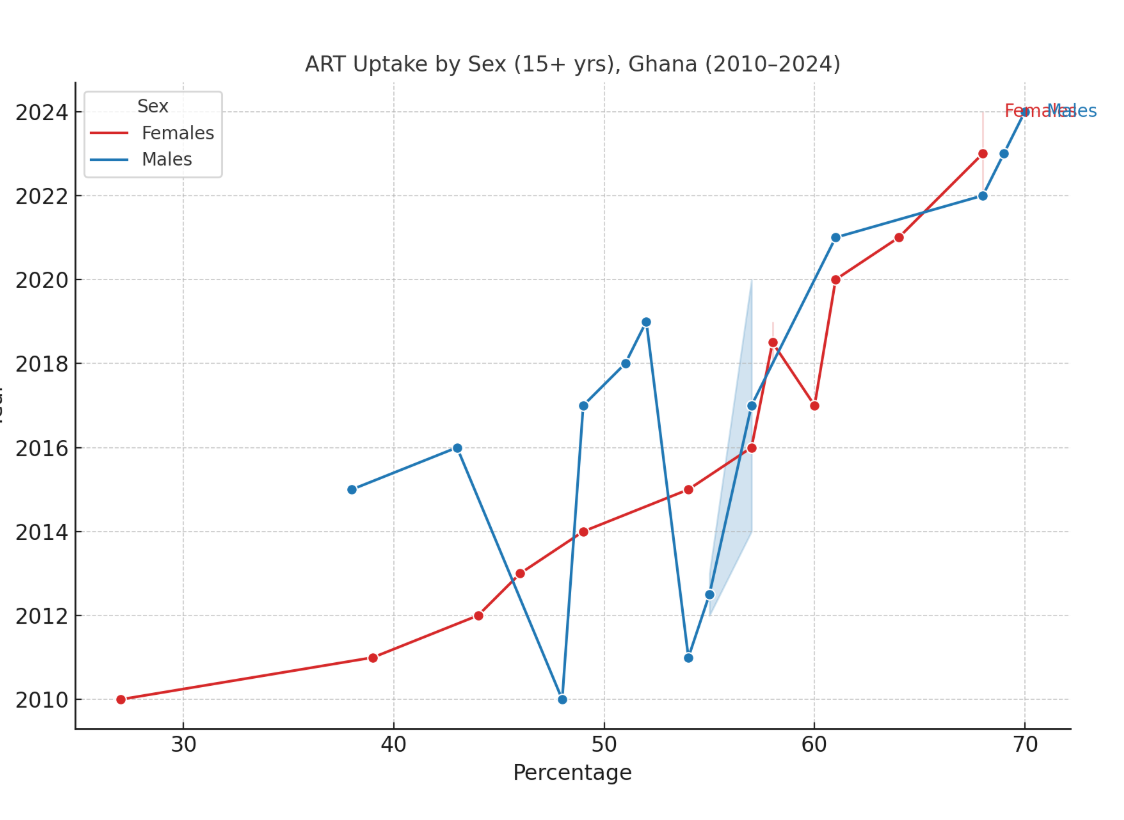
This project executed a comprehensive biostatistical and epidemiological evaluation of public health intervention equity and coverage trajectories for neglected tropical disease (NTD) control—specifically focusing on Taenia solium (taeniasis/cysticercosis) transmission dynamics and comparative healthcare uptake across vulnerable demographic strata. Evaluating long-term progress toward World Health Organization (WHO) control and elimination targets requires rigorous tracking of health disparities over time, assessing whether mass drug administration (MDA), diagnostic screening, or targeted therapeutic coverage is equitably distributed across sex, age groups, and socioeconomic divisions. To rigorously quantify and communicate these longitudinal equity gaps, custom equiplots and health equity disparity curves were engineered using the R statistical computing environment (ggplot2, dplyr, and patchwork). Equiplots serve as a critical tool in global public health and implementation science, explicitly mapping how coverage percentages evolve across distinct population subgroups (such as males versus females aged 15+ years) across a multi-year observational window (spanning 2010 through 2024). The statistical workflow involved ingesting multi-stage cluster survey data and longitudinal surveillance records, preprocessing disaggregated coverage metrics, and calculating point estimates alongside 95% parametric confidence intervals to account for sampling variability and complex survey design effects. Data normalization and structural reshaping transformed sparse, multi-cohort epidemiological matrices into tidy formats optimized for custom programmatic rendering in R. The visual architecture of the equiplots was tailored to optimize clinical and policy interpretability. By mapping calendar years against percentage coverage axes with flipped coordinate dynamics, the visualization clearly contrasts subgroup trajectories—such as the differential uptake rates between females and males—while highlighting critical inflection points, divergence trends, and transient coverage shocks. For instance, the analysis highlighted baseline equity gaps in early intervention years (where male participation lagged at 38.0% compared to female baseline trajectories), followed by sharp, non-linear fluctuations during mid-program phases (including temporary drop-offs down to 48.2% around structural healthcare disruptions), before undergoing steady convergence toward equitable high-coverage plateaus exceeding 68.0% to 70.0% in recent years. Point-wise uncertainty was incorporated using shaded confidence ribbons and vertical error bars, ensuring that non-overlapping intervals could be visually audited for statistical significance across adjacent timepoints. In addition to raw coverage tracking, the analytical framework evaluated subgroup disparity ratios, slope indexes of inequality (SII), and relative indexes of inequality (RII) to measure whether targeted public health strategies effectively reduced structural marginalization over time. The generating scripts in R incorporated custom theme scaffolding—utilizing minimalist grid structures, direct inline label annotations (eliminating cognitive load from legend cross-referencing), color-blind accessible palettes, and precise scale formatting—to deliver publication-ready graphics suitable for policy briefs and epidemiological reports. Ultimately, this work bridges complex longitudinal biostatistics with clear equity visualization, establishing a scalable data framework to monitor NTD intervention parity, optimize resource allocation, and drive data-informed strategies for endemic disease elimination.
Resources