
Project
Interactive Excel Dashboard for Sales Performance Analytics Using Pivot Tables
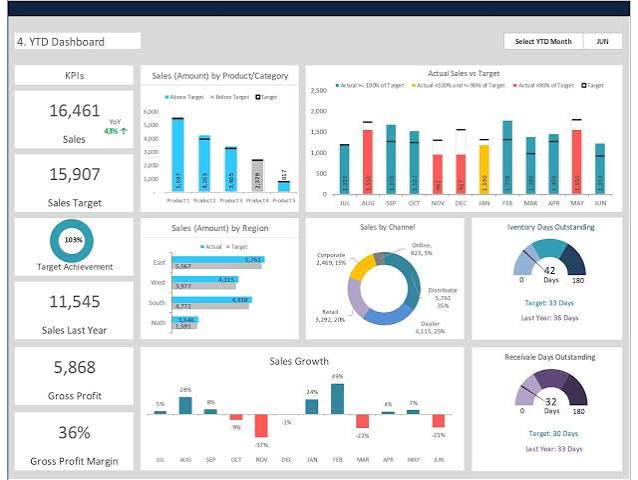
This project showcases a fully interactive Excel-based dashboard for analyzing sales data across products, stores, and sales representatives. Using raw transaction records, pivot tables, and dashboard visualization tools, the project enables stakeholders to monitor sales volume, revenue, and rep-level performance across time. Key Features: Data Source: Sales transactions with fields like Date, Store, Salesperson, Product, Quantity, Price, and Total Sales Pivot Table Automation: Total sales by product Performance comparison by store Rep-wise breakdowns for target monitoring Dashboard Views: Monthly performance summaries Top-performing stores and reps Dynamic product trends Technical Tools Used: Excel Pivot Tables Slicers and filters Conditional formatting Charting tools (e.g., column, bar, and pie charts) Impact: Delivers quick insights for decision-makers with no coding required Provides a lightweight alternative to BI tools like Power BI or Tableau Serves as a template for scalable sales dashboards in small to mid-sized retail settings Skills Demonstrated: Data cleaning and modeling in Excel Dashboard layout design for end-user consumption Interactive visualization techniques using native Excel tools Understanding of business KPIs and performance metrics
Resources