
Project
Interactive Tableau Dashboard on Global Electric Vehicle (EV) Trends and Market Drivers
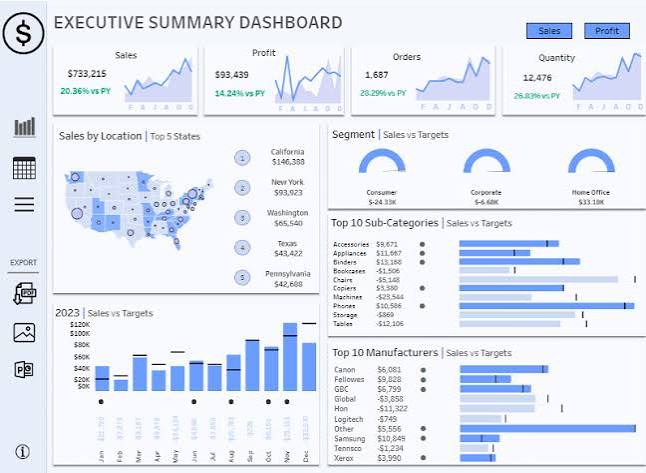
This project delivers a Tableau-powered interactive dashboard analyzing global electric vehicle (EV) adoption, regional disparities, and the key economic, technological, and policy drivers shaping the EV market. The dashboard integrates quantitative data with visual storytelling — using custom images and map-based insights — to illustrate trends, barriers, and opportunities in the EV ecosystem. Core Themes Covered: Global EV sales growth and market penetration by year and region Top EV-adopting countries, including China, the U.S., and EU members Barriers to EV adoption, such as infrastructure, cost, and policy gaps Market drivers, including incentives, climate regulations, and innovation Technical Highlights: Tool Used: Tableau Desktop (packaged workbook in .twbx) Data Format: .hyper file for fast in-memory analytics Visuals Included: Custom image overlays Multi-page dashboard design Region-specific map layers Interactivity Features: Filters for countries, year, and EV type Drill-downs for market share trends and comparison views Skills and Value Demonstrated: Built an interactive BI tool combining quantitative and visual storytelling Demonstrated data visualization best practices in Tableau Applied domain knowledge in sustainability and mobility innovation Highlighted ability to extract insights from fragmented global datasets
Resources