
Project
Power BI Dashboard Portfolio: Sales, HR, Employee Performance, and Predictive Reporting Projects
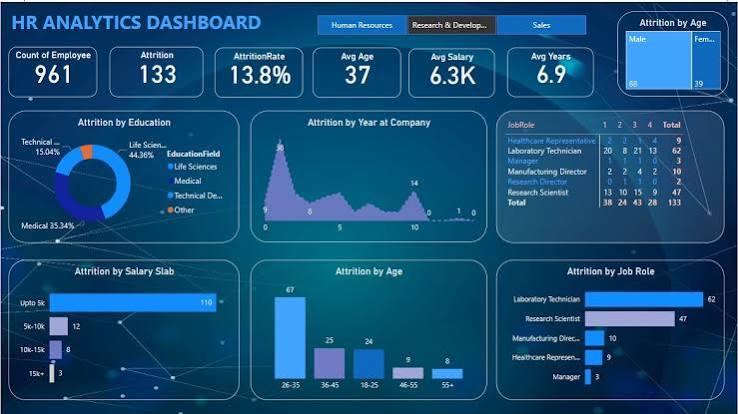
This portfolio presents a diverse collection of Power BI dashboards developed to analyze business data across multiple domains, including sales, human resources, employee productivity, and customer behavior. Each dashboard demonstrates a structured approach to transforming raw datasets into insightful, interactive reports that support data-driven decision-making. 1. Dashboarding in Power BI (.pbix) A general-purpose dashboard showcasing core Power BI capabilities including slicers, card KPIs, multi-page navigation, drill-through actions, and dynamic filtering. Built as a training and demonstration model for BI design best practices. 2. Titanic Dashboard Report (.pbix) Analyzes survival patterns from the Titanic dataset, using data modeling, measures, and visual storytelling: Survival by class, gender, age group, and embarkation point Slicers and filters for scenario comparison Demonstrates DAX logic, calculated columns, and relationship modeling 3. Employee Performance & Productivity Dashboard (.pbix) Focused on HR analytics, this dashboard provides insight into: Department-wise performance ratings Productivity trends over time Absenteeism patterns and employee engagement indicators Metrics for evaluating HR efficiency and managerial decisions 4. Adventure Works HR Report (.pbix) Built using the Adventure Works sample dataset to simulate corporate HR analytics. The dashboard includes: Headcount and attrition tracking Gender and age distribution Recruitment pipeline and internal mobility trends Salary and benefit insights by department 5. Sales Dashboard (from image file mY PROJ SALES.png) A sales monitoring dashboard summarizing: Monthly and quarterly revenue Product performance comparisons Regional sales distribution Customer segmentation and sales channel analysis Key Features Across Dashboards: Use of DAX (Data Analysis Expressions) for calculated metrics Custom visuals, tooltip pages, and drill-through navigation Interactive slicers for real-time segmentation Clean UI design focused on business storytelling and accessibility Tools and Technologies: Power BI Desktop DAX Data modeling and transformations using Power Query (M language) External data sources: Excel, CSV, and sample databases (e.g., Adventure Works) Outcomes and Impact: Delivered scalable, reusable, and business-ready dashboards Enabled decision-makers to identify trends, anomalies, and opportunities quickly Demonstrated ability to work with both real-world and simulated datasets across functional areas This portfolio reflects well-rounded expertise in business intelligence using Power BI, with strong attention to visual design, data modeling, and stakeholder communication. It showcases versatility in domain knowledge, from HR analytics to sales performance and predictive insights.
Resources